INTRODUCING: Mid-Spatial Frequency Surface Metrology

Measuring Mid-Spatial Frequency (MSF) is difficult. We have struggled with our vendors to provide adequate MSF control on our optics and high-end optics for semiconductor, high energy laser, X-Ray, and even autonomous vehicles require strict control of MSF’s
Now the Ä9|9MP Fizeau interferometer enables practical Mid-Spatial Frequency measurement. This is accomplish by the combination of high performance optical design, controlling spatial and temporal coherence, and rapid data acquisition during averaging.
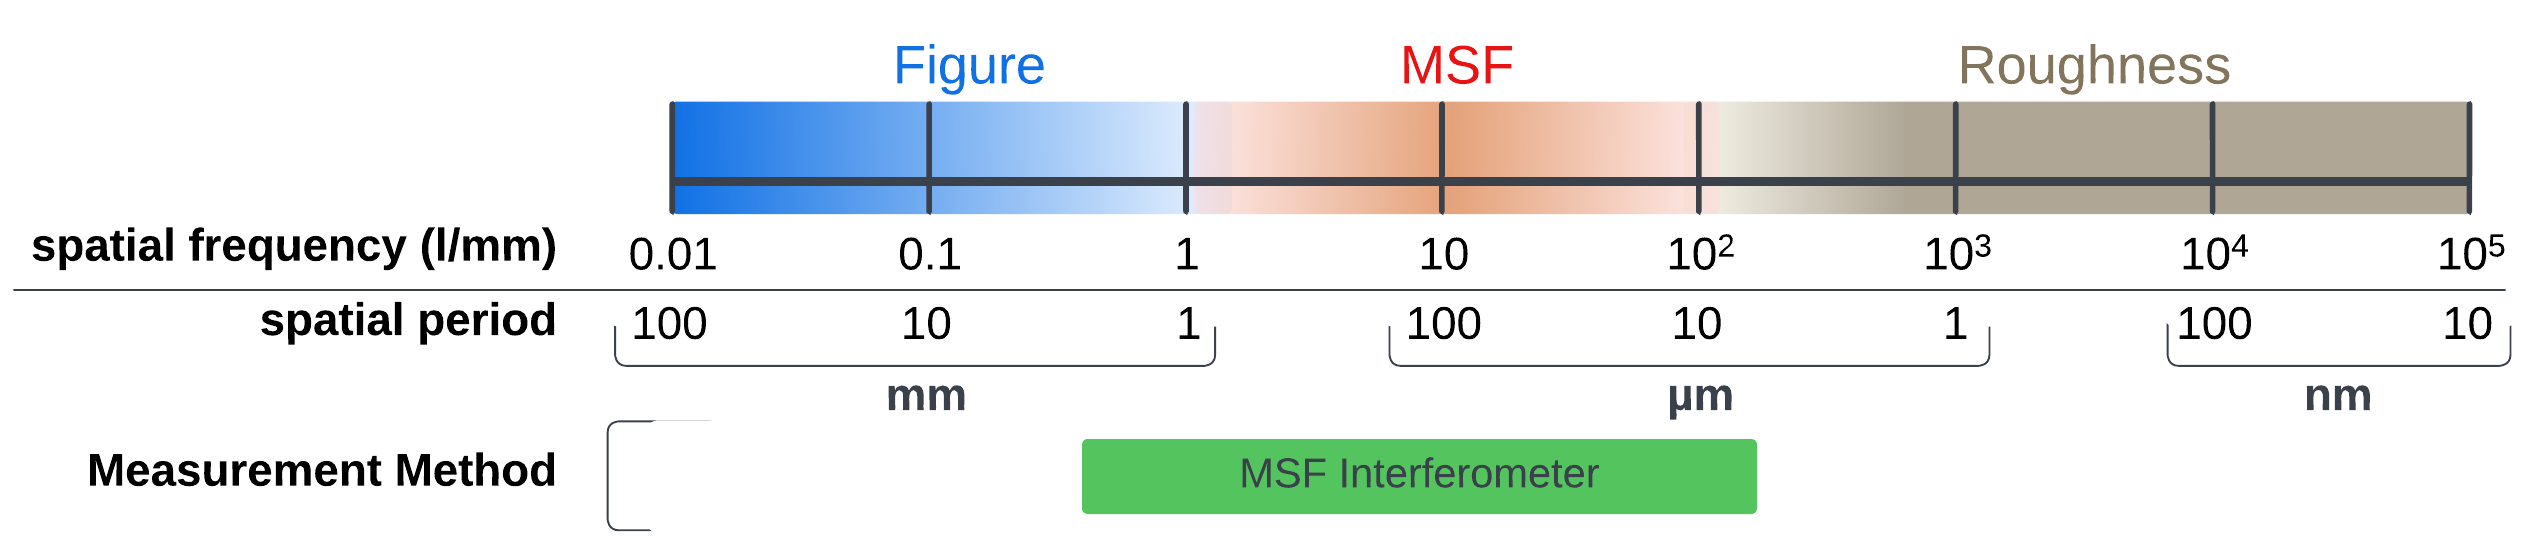
An effective Mid-Spatial Frequency (MSF) measurement instrument needs to overlap and fill in the gap between both the form and roughness domains covered by other instruments, while accommodating substantial surface slopes with minimal retrace errors. Furthermore, it must achieve a low noise floor of tens of picometers of surface height accuracy, while remaining user-friendly.The Ä9|9MP fills the required gap spanning the spatial frequency range of 0.2 l/mm to 125 l/mm, see figure below.
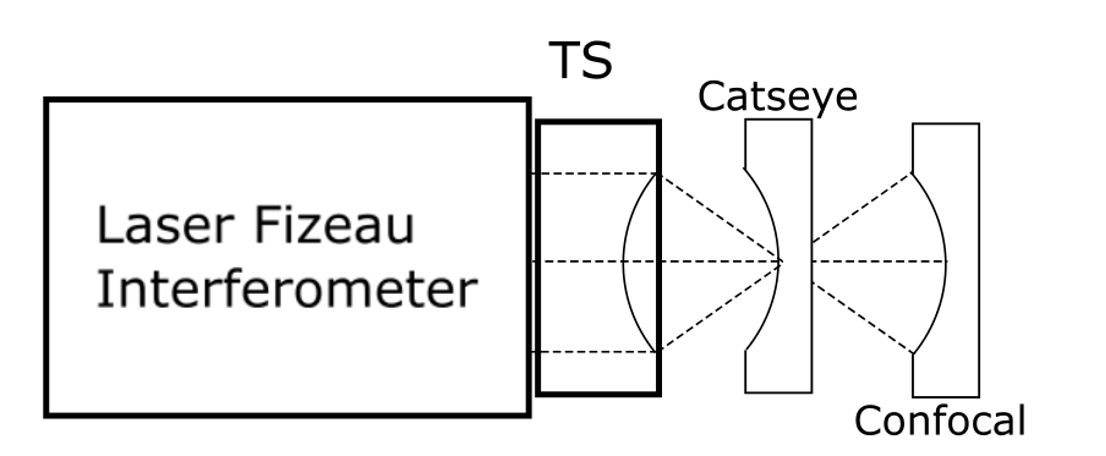
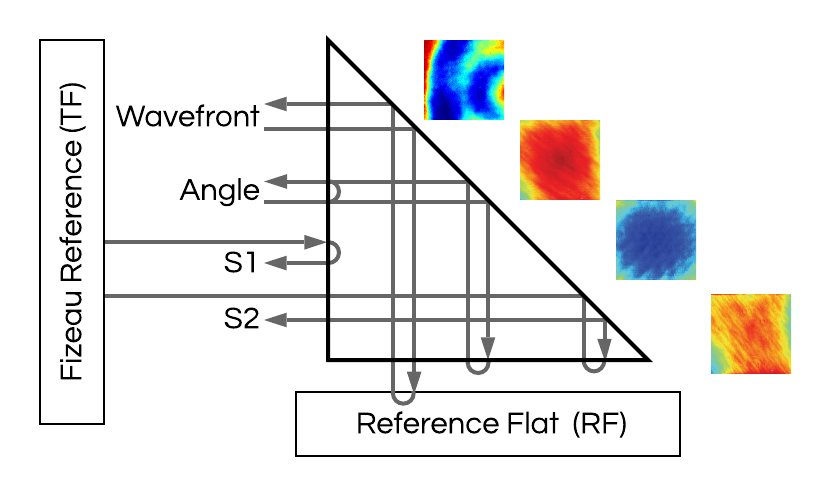
For the Ä9|9MP a plano system was chosen, akin to a White Light Profilometer (WLP), but adopting a Fizeau design. A Fizeau design is enabled by ÄPRE’s SpectrÄ source. This architecture also allowed the integration of a super-polished reference flat, minimizing the size and magnitude of MSF errors within the reference optic.
The aim of measuring a surface radius of 120 mm even with a flat reference surface is possible with the 9 mm field of view. For radii <120 mm the field of view decreases, but continues to overlap with the resolution range of advanced Fizeau interferometers. Notably, the design achieves retrace error performance approaching λ/20, even at maximum slopes of 1,200 fringes across the field of view. Crucially, these minute retrace errors fall outside the typical spatial frequency range of Mid-Spatial Frequencies, rendering them filterable and thus inconsequential to the final measurements.
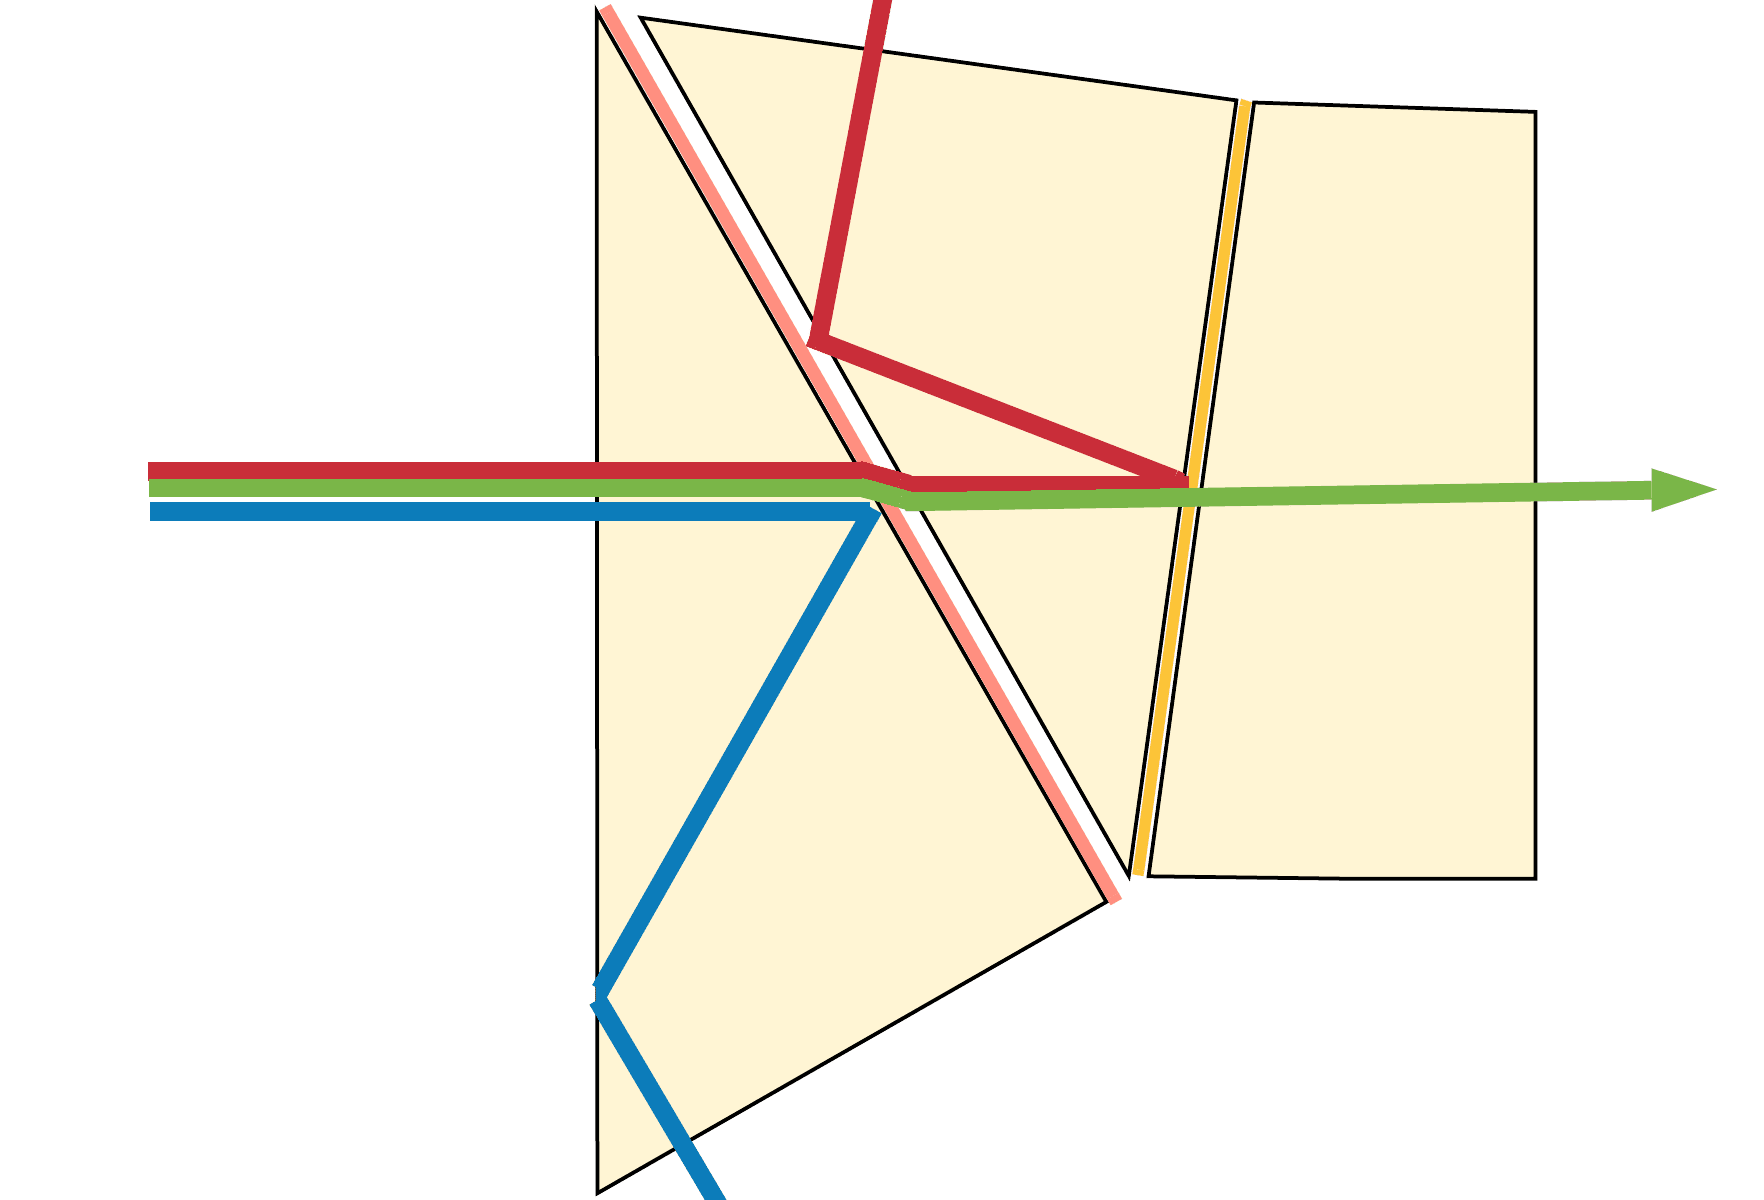
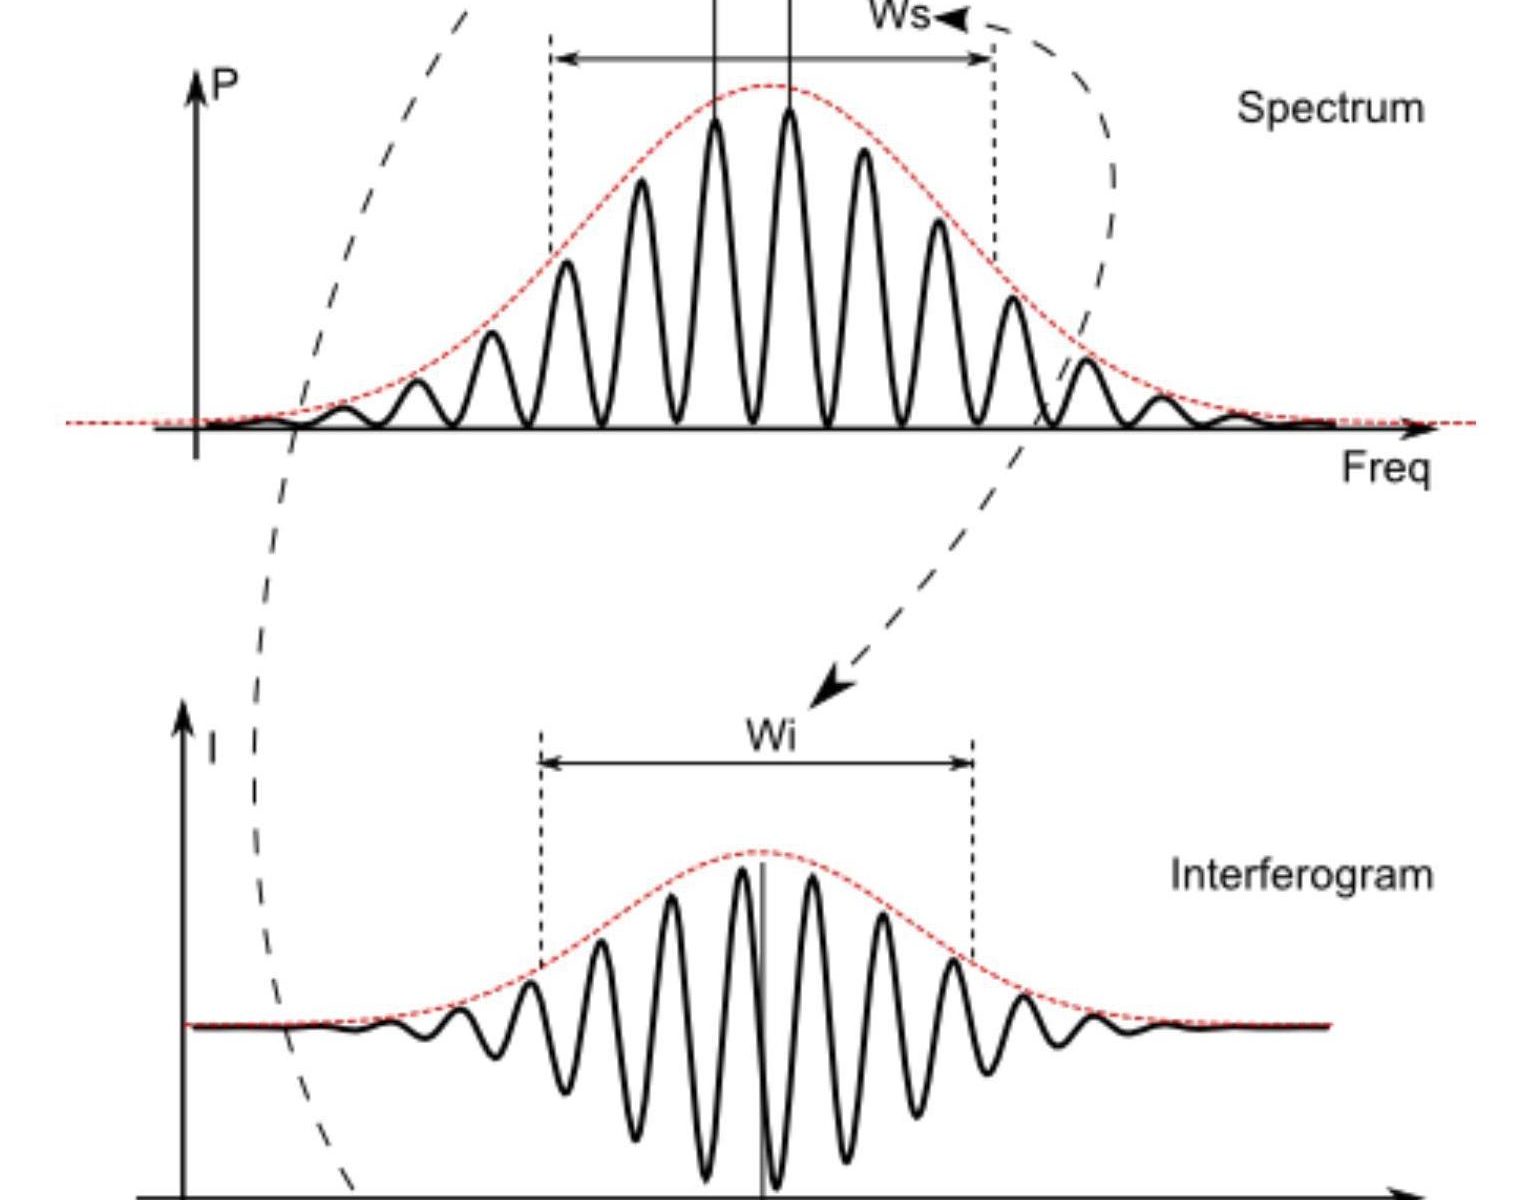
A low noise floor is accomplished by employing short temporal and spatial coherence. Temporal coherence control is accomplished using Spectrally Controlled Interferometry (SCI) technology. Alignment can be performed in the laser, long coherence mode. SCI electronically switches to the short coherence measurement mode. In the short coherence mode interference fringes are isolated solely to the measurement surface. This effectively eliminates interference fringes produced by other surface back reflections. To further eliminate any remaining coherent artifacts a spatial coherence buster is applied. During averaging of measurements spatial coherence is minimized. Thus averaging both removes speckles and spurious fringes, and other noise sources to minimize the measurement noise floor. This unique combination simulates the performance of a white light source within a Fizeau interferometer setup.
To achieve picometer noise floor measurements averaging is required. The Ä9|9MP system can acquire data with vibration tolerant Phase Measurement or Synchronous Phase acquisition. Both are electronically controlled by the spectrally controlled source. Synchronous phase acquisition is enabled by the SCI’s continuous and \textit{limitless} phase shifting, independent of cavity length. Consequently, it enables averaged acquisitions at over 10 times the speed of conventional methods, only limited by the camera’s frame rate. Averaging numerous frames of data can be performed rapidly, reducing measurement time significantly. Spectral Synchronous Phase acquisition is one more unique feature of SCI technology.
The Ä9|9MP is available in a fully automated system, or a bench top model.

Optical Surface Radius of Curvature

Optical surface radius is a primary control parameter. It must be measured to confirm the optical element meets specification. Spectrally Controlled Interferometry promises a faster and more accurate method to measure surface radius.

Multiple methods are presently used to measure radius.

  • Test plates: A test plate has a pre-measured radius to which the test surface is compared, the difference is power fringes is reported.
  • Mechanical probe: The sagitta of the lens surface is measured over a fixed diameter, from which radius is calculated. Small changes in sagitta measurement can lead to large errors in reported radii.
  • Interferometer “Cateye to Confocal”: An interferometer with a transmission sphere (TS) is set up at the catseye position off the surface of interest, and position noted. Then the lens is moved to the confocal position and the position noted. The difference in positions is the radius. PMI interferometers also compensate for any residual power in the measurements due to imperfect positioning. The positions are shown in figure 1.

Interferometer radius measurement is the “gold standard” method today. To achieve this measurement the following additional equipment is needed:

  • Lens mount that allows for free motion along the axis of the lens (Z axis) to micrometer position accuracy
  • Free Z motion over up to a meter, with micro-radian angular alignment to minimize cosine errors.
  • A separate Z position metrology tool. Either a glass scale or a displacement measuring interferometer (DMI) The DMI is the most accurate as it minimizes Abbe offset errors, though it adds environmental uncertainty if not calibrated.
Figure1: The distance between catseye and confocal is the surface radius. Note extra mechanical fixturing and metrology instruments are needed to measure the positions accurately

Spectrally Controlled Interferometry (SCI) Radius Measurement

SCI has a unique combination of four properties:

  • Easy alignment in laser mode
  • Electronically switch to white light mode to isolate fringes to the surface of interest
  • Measures the cavity phase electronically (no mechanical motions)
  • Measures the absolute distance of the measured cavity

SCI Absolute Position Measurement

The SCI source parameters that determine the absolute distance measurement are:

λ0 = The nominal wavelength of the SCI source
Δλ = A tunable source parameter

The absolute distance from the transmission sphere to the optical surface is:

lc = λ20 / 2Δλ   (1)

This combination means SCI can provide all the measurements required for surface radius with neither an additional DMI, nor the precision mechanics to move from Catseye to Confocal position.

SCI Radius Measurement

Since SCI can measure absolute position there is no requirement to measure at two positions. For the first time surface irregularity and radius can be measured at the same time. This also improves measurement accuracy by the elimination of several error sources as discussed below.

SCI Radius is measured by first calibrating the radius of the TS = RoCTS. Then directly measuring the cavity length lc with SCI and calculating the part RoCx from:

RoCx = RoCTS – lc   (2)

Figure 2: Measuring surface radius of SCI requires calibrating the TS radius and then directly measuring the cavity length and calculating the Test Optic radius.

Measurement Accuracy

Repeatability

The foundation of accuracy is repeatability. If a measurement process is repeatable it can then be calibrated to yield accurate results. Repeatability of measurement has been shown to be <0.5 µm for radii in the 20 mm to 175 mm range. This repeatability is better the best measurements with DMI’s.

Accuracy NIST Study

In 2001 NIST ran an experiment to determine the error sources and limits of accuracy for surface radius1. The results of that experiment and error sources are shown in figure 3, along with estimates from Typical DMI and Typical Scale (Glass) radius benches and SCI. 

A key observation is most of the error sources are due to measuring the distance between catseye and confocal. In the NIST study fully 90% of the errors are in this part of the measurement. The same is true for the DMI and Glass Scale. The only difference is the magnitude of the errors that are 16X and nearly 500X greater, respectively, than the NIST study. 

These values are a precaution to users of a DMI or glass scale radius bench to not underestimate the errors in the measurements.

Figure 3: Surface radius error budget for several methods of measurement.

SCI Eliminates the Z Axis Motion Error Sources

No Z motion eliminates the first six error sources (green). Leaving the balance of the error sources that are equal to the Typical DMI set up. SCI can potentially improve the uncertainty to better than the NIST study.

An additional error source is the calibration of the TS radius that also must be added. Since it can be bootstrapp calibrated to the same level a simple doubling of the errors to ~50 nm is expected. 

As of October 2020 SCI can measure surface radius up to 250 nm cavity lengths, and potentially out to 500 mm cavity lengths. 

Summary

SCI promises to replace traditional catseye-confocal lens surface radius measurement by saving time and greatly improving accuracy. It is the go to method for high-performance lens radius metrology.


1 T. Schmitz, A. Davies, C. Evans; Uncertainties in interferometric measurements of radius of curvature, Appeared in Optical Manufacturing and Testing IV, H. Philip Stahl, Editor, Proceedings of SPIE Vol. 4451, 432-447, 2001

Measuring Material Homogeneity with SCI

Material Homogeneity

Optical index homogeneity is an important material parameter influencing lens performance. Laser interferometers have painstakingly measured this parameter which requires four separate measurements.  Laser interferometers have either required the use of contact plates with oft times poisonous index matching fluids. Or polishing a wedge into the test part to isolate the front from the back surface. In both cases the test part must be repeatedly tilted to isolate from test parts front and back surfaces as shown in figure 1. Tilting lowers the measurement accuracy as the test beams do not return over themselves (common path operation is lost), makes the test more complicated, and slows the measurement down exposing the test part to thermal variations increasing measurement uncertainty.

figure 1: Four measurements are required to measure homogeneity. With a laser source the test part must be tilted twice adding measurement errors and complicating the measurement.

Laser Wavelength Scanning Fourier Interferometer

Recently laser wavelength scanning Fourier (LWSF)  interferometry has been used for homogeneity measurements. LWSF enables the test part to be plane parallel polished and set up where no tilting during the measurement sequence is required. Once set up two measurement sets are required, one with the test part and one without. LWSF takes up to a minute to measure the cavity, therefore it exposes the measurement to environmental changes, limiting repeatability and accuracy. Plus vibration tolerant phase algorithms are not applicable.

LWSF Surface Confusion

Plus there can be confusion as to what surfaces are measured since the Fourier algorithm “finds” the six sets of fringes present in the cavity of which only four are of interest. 

SCI Simplifies Homogeneity Measurements for Improved Accuracy

SCI, similar to LWSF, uses a plane parallel polished test part to measure homogeneity. Therefore the test part is easy to manufacture. In the laser alignment mode SCI enables easy alignment of the four surfaces. Starting with the empty cavity nulled alignment, then adding the test part and minimizing fringes to complete alignment. 

With SCI only the cavity to be measured is seen, there is no confusion. After setting up, switch to the short coherence, white light, mode:

  1. Select the transmission flat (TF) to test part S1. Measure with vibration tolerant (VT) PSI in < 1 second.
  2. Then electronically select TF to S2 and measure with VTPSI. 
  3. Now select the TF to RF cavity – through the test part – measure. 
  4. Finally remove the test part and measure the TF to RF cavity. 

REVEAL homogeneity application leads the user through these sets, see figure 2. 

figure 2: REVEAL leads the user step by step through the process. Enable the next measurement to be made and proceed.

Once the four measurements are complete the homogeneity result computed automatically, see figure 3.

figure 3: The final result of four measurements with the homogeneity mapped on the right and PV result of 19.107 ppm shown in the middle bottom.

See the link below for a ÄPRE technical paper regarding the computing the uncertainty of measurement of homogeneity measurements.

Summary

Homogeneity is an important performance parameter for optical materials. Spectrally Controlled Interferometry (SCI) simplifies the measurement, improves accuracy and ÄPRE REVEAL software leads the user step by step through the process.

Homogeneity Measurement Uncertainty Technical Paper >

More Applications >

Learn More about SCI>

Applied Optics Paper >

Let’s Talk>


Measuring Optical Domes: Faster and More Accurate with SCI

Optical domes are an important component in environmentally challenging imaging environments. Accurate metrology is required to achieve good imaging system performance. 

Applications of Dome Optics

Examples of Optical Domes

Dome optics are the last component in a growing number of imaging and guidance applications. Domes protect the imaging optics from the surrounding environment without degrading optical performance. Therefore the dome’s transmitted wavefront quality is important to control as it directly influences the final image quality.  Dome applications include: 

  • Underwater Camera
  • Submersibles for robotic and manned exploration
  • Unmanned aerial vehicle
  • Remotely Piloted Vehicle
  • Space applications
  • Missile Guidance System
  • Security systems

Manufacturing Parameters to Control

Transmitted wavefront is degraded by several parameters which must be controlled during manufacture:

  • Individual surface irregularity
  • Front-to-back surface thickness variation (TTV)
  • Front-to-back surface decenter (X-Y)
  • Center of radii shift in Z
  • Transmitted wavefront

Typical Metrology Methods

Laser Fizeau Interferometer

A laser Fizeau interferometer appears as an obvious choice to measure domes. Transmitted wavefront and surface irregularity are typical parameters measured with a Fizeau interferometer. The long coherence of the laser Fizeau frustrates these measurements as both surfaces mutually interfere with the reference sphere as well as the front and back surfaces creating three interference patterns overlaid making accurate surface measurement impossible. [Optically a dome is equivalent to a flat parallel plate and encounter the same measurement difficulties] Tilt can be introduced in an attempt to visually separate the surfaces, or one surface is painted black to lower the fringe contrast from that surface, but in the end the measurements are not reliable.

5-Axis CMM with Point Probe or Depth Probe

5-Axis Coordinate Measuring Machines (CMM) swings a probe

figure 1: 5 Axis CMM Geometry [Vahidi Pashaki, Pooyan & Pouya, Milad. (2016). VOLUMETRIC ERROR COMPENSATION IN FIVE-AXIS CNC MACHINING CENTER THROUGH KINEMATICS MODELING OF GEOMETRIC ERROR. Advances in Science and Technology Research Journal. 10. 207-217. 10.12913/22998624/62921.]
around the dome, measuring as it moves (see figure 1). If the CMM has ample range in the B Axis it can measure the full dome hemisphere. Two types of probes for surface sensing are used: A surface probe or a depth probe. The surface probe only measures one surface at a time and thus does not measure TTV or decenter. The depth probe measures both surfaces simultaneously providing measurement of all parameters except transmitted wavefront. 

The measurement reference or metrology frame is created by controlling the CMM’s motions. Motion control of a point in space (the probe) is technically difficult especially with 5 non-orthogonal axes are concerned. Therefore the measurement accuracy is degraded compared to a Fizeau interferometer that has a fixed reference (metrology frame). 

The 5-Axis CMM is slow to measure (minutes to hours depending on the resolution of data to acquire), typically expensive if state-of-the-art measurement uncertainty is achieved (~$750,000 [ USD]) and even then they do not approach optical metrology accuracy required.

SCI Fizeau: Fixed Metrology Frame all Parameters Measured

The Fizeau configuration is optimal considering accuracy. With ÄPRE’s Spectrally Controlled Interferometry (SCI) the coherence is controlled enabling the measurement of all parameters. 

figure 2: Dome setup in Fizeau measurement configuration

Just like for a plane parallel plate the SCI coherence can be adjusted to create fringes on each surface individually and between the front and back surfaces. In this way an accurate, fast method exists to measure all dome parameters. The following interference cavities provide the required results:

  • Surface Irregularity 1: Fizeau Sphere Reference to Surface 1 (PVr & RMS: Tilt & Power removed)
  • Surface Irregularity 2: Fizeau Sphere Reference to Surface 2 (PVr & RMS: Tilt & Power removed)
  • TTV: Surface 1 to 2 (PVr result)
  • Decenter (X & Y): Surface 1 to 2 (Tilt result)
  • Center of radii shift in Z: Surface 1 to 2 (Power result)
  • Transmitted Wavefront: Fizeau Sphere Reference to Additional Reference Sphere (PVr & RMS: Tilt & Power removed)
figure 3: Typical SCI Dome results without the multiple interference which frustrates measurement

The region of measurement is determined by the Fizeau sphere f#. A faster (lower number) sphere the more coverage. To cover a full hemisphere an f# of 0.5 is required and these do not exist. Tilting the sphere to the edges enables coverage of the full hemisphere over a series of measurements. 

Summary

Domes are an important element in imaging systems used in environmentally challenging environments. ÄPRE’s SCI technology provides rapid and accurate measurements of all parameters in one setup. 

More Applications >

Learn More about SCI>

Applied Optics Paper >

Let’s Talk>

Measuring Prisms: Multiple Wavefront Channels In One Setup

Prism Stacks Produce Multiple Wavefronts

Prism stacks are difficult or even impossible to measure with a laser interferometer, yet are easy to measure with Spectrally Controlled Interferometry (SCI). 

Examples of prism stacks for projector imaging systems, displacement measuring, monolithic or assembled component interferometers, and RGB combiners. 

Laser Interferometer Back Reflections

A laser light source interferometers (for example a laser Fizeau) create fringes from every back reflecting surface. In some prism assemblies these are created in multiple channels and are superimposed creating confused interference patterns that are impossible to measurement. 

Spectrally Controlled Interferometry Eliminates Back Reflection 

Spectrally Controlled Interferometry (SCI) can selectively isolate the interference cavity of interest for easy and accurate measurement. And as opposed to white light “delay line” interferometers, SCI is easy to align alignment prior to measurement using its long coherence alignment mode.

Imaging System Prism Stack

In an imaging prism stack the transmitted wavefront passes through several back reflecting surfaces, see figure 1. In this case there are four potential back reflection surfaces. SCI can measure each of these independently if the surface is of interest, or only the transmitted wavefront without corruption. This allows a straight on measurement without tilting or distorting the wavefront.

Figure 1: Schmidt-Pechan Prism. The circled interfaces are areas where back reflections can prevent accurate measurements with a laser interferometer. (ref. https://commons.wikimedia.org/wiki/File:Schmidt-Pechan_prism.svg)

Displacement Measuring Interferometer Components

Interferometers for displacement measurement typically have multiple channels for the test and reference beam path. SCI enables the measurement of each channel independently, without the degrading influence of multiple entry and exit surfaces. To select the measurement channel cavity the polarization is rotated by 90º from one to the other, which is accomplished at the interferometer. [A linear polarized interferometer, where the polarization can be rotated, is used for this application. Contact ÄPRE for more information.]

Figure 2: a-WOW Interferometer for measuring displacement and angle. (ref. Loughridge, Russell & Abramovitch, Daniel. (2013). A tutorial on laser interferometry for precision measurements. Proceedings of the American Control Conference. 3686-3703. 10.1109/ACC.2013.6580402.)

RGB Prism Combiners

RGB (red-green-blue) prism combiners are particularly difficult to measure. The three channels must be separated to measure each path’s transmitted wavefront, yet optically they are co-axial. With a laser interferometer this is impossible, as all the wavefronts overlap, see figure 3. Plus there are multiple back reflecting surfaces that must be eliminated for an accurate measurement. Each channel can be aligned independently in the long coherence align mode. Then selected in the short coherence mode for accurate measurement. 

Figure: 3: Dichroic Prism for RGB selection. The red circle indicate surfaces that reflect back into the interferometer confusing or suppressing the measurement.

Interferometer resolution

Many RGB prism combiners are classed as micro-optics with a less than 6 mm clear aperture. Therefore a standard 4 inch (100 mm), zoomed imaging interferometer with ~400µm image resolution or worse at all zoom magnifications, has insufficient image resolution. A minimum of 60 µm image resolution is required to measure the wavefront of a 6 mm clear aperture prism. 60 µm resolution yields a 100 X 100 image resolution across a 6 mm clear aperture.


Figure4: Image resolution demonstrated for 100 mm aperture interferometer. Airy disk size properly sampled at ≥Nyquist limit is required

NOTE:  This is not 100 X 100 pixels but image resolution. The camera array must be 2X this or a minimum of 200 x 200 pixels AND the imaging optics must produce an airy disk size of 60 µm. At 100 X 100 image resolution 36 Zernike polynomials are accurately calculated. See Figure 4.


Shown in figure 5 is ÄPRE’s S6|HR interferometer with 15 µm image resolution capable of measuring the transmitted wavefront in components to 1.5 mm clear aperture.

Figure 4: ÄPRE S6|HR interferometer with SCI light source for measuring micro-optics including prisms and prism assemblies.

Spectrally Controlled Interferometry Separates the RGB Channels

Again with a laser interferometer the three channels create back reflections simultaneously making the measurement impossible. In the measurement set up (see figure 5) each six prism assembly cavity has three cavity of different optical path lengths. Therefore the distance between the test and reference flat is different for each channel. With SCI each channel is selected one-at-a-time. Typical measurement results with SCI and S6|HR are shown in Figure 6. 

Figure 5: RGB Prism assembly setup with S6|HR Interferometer.
Figure 6″ Typical results measuring an RGB prism assembly with S6|HR and SCI. One setup three results in seconds.


Summary

Prisms assemblies are difficult optical elements to measure. Back reflections from multiple surfaces and multiple channels make laser interferometry incapable of making these measurements. SCI offers an easy to use, accurate method to measure these components for the first time. 

More Applications >

S6|HR Interferometer Specification>

Learn More about SCI>

Applied Optics Paper >

Let’s Talk>

Measuring Prisms: S1, S2, Wavefront + Relative Angle

Prisms are complex optical components. Transmitted wavefront performance is controlled by multiple surfaces, the angle between them, and the material homogeneity.  SCI makes interferometric prism measurement fast, easy and more accurate than conventional methods.

Conventional Approach: Multiple Instruments, Delayed Shipments

Prisms are typically measured on multiple instruments and in several setups. A goniometer measures angles, and an interferometer measures the surface flatness of S1 and S2, and transmitted wavefront (which includes the homogeneity). And in a separate set up, the relative angles are measured in an interferometer. Multiple instruments and setups increase the time of measurement, slowing manufacturing and delaying the shipment of finished parts.

Laser Fizeau: a Compromised Measurement

Multiple surface interference prevents direct measurement of prism without work arounds

Complicating the laser Fizeau measurement are multiple back surface reflections between surfaces S1 and S2 and the transmission flat (TF) and reference flat (RF). Workarounds exist that add time and degrade the measurement accuracy while also increasing risk of component damage.

Surface Flatness with Laser Fizeau

Back reflections from S1 and S2 force the user to frustrate the fringes on the opposite surface by painting or greasing. The procedure is to paint S2, measure S1, strip the paint off S2 and paint S1, the measure S2, clean S1 and continue processing; this cycle is repeated until the prism meets specification.

Transmitted Wavefront with Laser Fizeau

The Prism must be tilted to measure transmitted wavefront with a laser Fizeau interferometer

Transmitted wavefront measures the wavefront passing through the prism, and consequently through S1 and S2. To suppress multiple reflections the prism must be rotated so the light reflected off these surfaces falls outside the interferometer’s acceptance angle. Thus the transmitted wavefront measured in a laser Fizeau is not in the “as used” unrotated orientation.

SCI Simplifies the Measurement

Spectrally Controlled Interferometry (SCI) simplifies and speeds up the measurement process. Now all four parameters can be measured in one setup with no preparation for increased accuracy, faster cycle time and lower risk of damage.

SCI with Fizeau interferometer setup. All important parameters are measured in one setup.

With SCI, no surface preparation is required. Setup the prism as shown in Figure 1. With SCI, the prism measurement is first set up in a long coherence mode, similar to that of a laser Fizeau. This allows fringes to be quickly observed and nulled for multiple cavities at once, making setup fast and precise. Next, the SCI source is placed in the short coherence mode to localize fringes to a single cavity. Individual measurements can now be made by electronically selecting each of the four cavities, one at a time. First, surface figure is evaluated by selecting the interference between the transmission flat ( TF reference surface) and S1 is selected and measured, followed by the transmission flat and S2. Then the S1-S2 cavity, the relative prism angles, is selected and measured. Finally the TF to RF cavity is measured for transmitted wavefront.

All these measurements were made in one setup without preparation and can be done in less than five minutes including setup, a greater than 10X savings in time, with increased accuracy and lower chance of damaging the part.

Summary

Tradition methods to measure a prism are time consuming, with lower accuracy, potential causing damage to the part. New Spectrally Controlled Interferometry (SCI) maintains the ease of setup with long coherence fringes and then measures all critical parameters without surface preparation and too higher accuracy.

More Applications >

Learn More about SCI>

Applied Optics Paper >

Let’s Talk>

Glass Substrates: Total Thickness Variation (TTV)

Thickness variation (TTV), and often wedge, is specified in optical windows and substrates. There are two methods for measuring TTV: Front-to-Back and Direct.

Front-to-Back

TTV can only be calculated if the front and back measurements are performed without translating or moving the part. While this restriction poses challenges for traditional laser Fizeau systems, this is accomplished easily with SCI as the fringes are moved rather than the part.

  1. The front surface is measured, named, and stored in REVEAL’s clipboard
  2. The back surface is measured, and a correction is applied for the index of refraction.
  3. The two measurements are added to report the TTV.

An advantage of Front-to-Back TTV parts as thin as 100 µm OPL can be characterized.

Direct

The Direct measurement is accomplished by locating the SCI interference fringes inside the substrate itself. These fringes are called “internal Fizeau” fringes because the fringes are between the front and back surfaces or internal to the substrate. Once the SCI has localized fringes inside the substrate, the interference phase is directly measured and hence the TTV acquired. Phase measurement of internal Fizeau fringes is only possible by wavelength modulation (wavelength phase shifting) and SCI phase shifting. 

The OPL limitations for Direct TTV measurement are:

  • For wavelength modulation: OPL must be >2 mm and phase measurements can take more than 60 seconds
  • For SCI: OPL of 500 µm are possible with measurement times measured in milliseconds.

Summary

Measurement of a glass plate has many complications mostly due to interfering back reflections as found in a laser interferometer. SCI solves this problem and expands what can be measured on a substrate in one setup and with no preparation.

More Applications of SCI>

Learn more about SCI>

Applied Optics Paper>

Let’s Talk >

Measuring Plane-Parallel Substrates

Plane-Parallel Substrates

What could be easier than measuring a plate of glass? Actually, almost all interferometric measurements are easier! Measuring a plate of glass, or a substrate, is one of the most difficult interferometric measurements. In a laser interferometer, the two surfaces of the plate simultaneously interfere with the reference surface and each other creating three sets of fringes. When multiple sets of fringes exist it is impossible to make a measurement.

Laser Fizeau a Compromised Measurement

The laser Fizeau interferometer produces fringes off every surface. Therefore, back reflections off the unwanted surfaces must be suppressed in order to take an accurate measurement. The typical suppression method is to apply a foreign material to the back surface to reduce the magnitude of the back reflection and decrease these fringe’s contrast. This foreign material might be blue paint, grease, index matching fluid or tape.

Accuracy Degraded

These methods cannot completely diminish the fringe; their contrast is just reduced. By setting a modulation (contrast) threshold the laser Fizeau nominally ignores these fringes during measurement. Unfortunately thresholding is not foolproof. The low contrast secondary surface fringe intensities add to the higher contrast front surface fringes distorting the phase measurement. Therefore even though the results can improve, the back surface fringes still degrade the measurement.

The back surface coating can also warp the part, depending on the thickness to diameter ratio of the part. Most users assume the paint does not warp the front surface, but drying paint induces stresses and hence it degrades the accuracy, the larger the diameter to thickness ratio the more severe the potential warping.

Time Wasted/Costs Increased

The largest associated cost of measuring plano optics is the time wasted during sample preparation. Painting can take minutes to a few hours for the paint to dry1 and while the measurement can be fast, removing the paint can add hours to the processing.

Substrate Measurement with SCI

Front Side Measurement with SCI

Spectrally Controlled Interferometry (SCI) solves this problem. First, in the long coherence “laser mode” SCI allows for easy alignment, just like in a laser Fizeau. Then by electronically controlling the spectrum of the illumination, the coherence of the Fizeau interferometer is narrowed and positioned on the surface of interest, thereby limiting the interference to only one cavity. Therefore, substrates can be measured without preparation and to higher accuracy.

Standard SCI can isolate surfaces separated as thin as 150 µm Optical Path Length (OPL), where:

OPL = n (index of refraction) X d (physical thickness)

With custom designed SCI systems even thinner substrates are possible to be measured. Once the fringes are found a standard phase measurement is performed taking only milliseconds.

Back Side Measurement with SCI

Without moving the part, the fringes are electronically moved to the back of the substrate. Now the front surface is invisible and only the backside measured. The distance the fringes are moved is the OPL, making finding the second surface easy. A standard phase measurement is again performed.

This measurement was made through the material so the index of refraction must be accounted for. ÄPRE’s back side measurement profile (application in REVEAL) makes this correction. The REVEAL profile compensates for the index of refraction correcting the surface heights, while reversing the sign of the surface heights, as if it was measured face-on (air to glass).

Summary

Spectrally controlled interferometer coupled with a standard Fizeau interferometer enables direct measurement of the front and back surfaces of a substrate without requiring treating the surfaces to suppress back reflection interference. With easy alignment in a coherent “laser” mode and electronically isolated fringes SCI lowers the cost of measurement and improves accuracy.

More SCI Applications>

Learn More about SCI>

Applied Optics Paper >

Let’s Talk>

1 Users of SCI have noted they are saving hours-per-part switching from painting to SCI.