This includes the interferometer setup procedure for the wedge test, setting the correct values in Äpre’s REVEAL software to properly report wedge, and how wedge data is reported
Unique, Rapid Optical Wedge Measurement with SCI | “How To” using Äpre REVEAL Software
Watch in real time – a one click measurement of an optical wedge using an Äpre S100 Series interferometer and REVEAL metrology system.
Measuring an Optical Wedge with a Laser Fizeau Interferometer (Easy Method)
Optical Wedge Application (OWA) is an add-on analysis tool for measurement of optical wedges in either transmission or reflection. OWA can measure a single part or many parts simultaneously (e.g. on a pallet), as seen in Figures 2 and 3.
The Optical Wedge Application (OWA) is part of the Optical Shop Testing package and can only be accessed if purchased. OWA is not part of Äpre’s Basic Interferometry package.
OWA presents wedge data in two ways: Graphical displays of the measured wedge data along with wedge slope direction, and tabulated representations of calculated wedge data.
Tabulated wedge data includes:
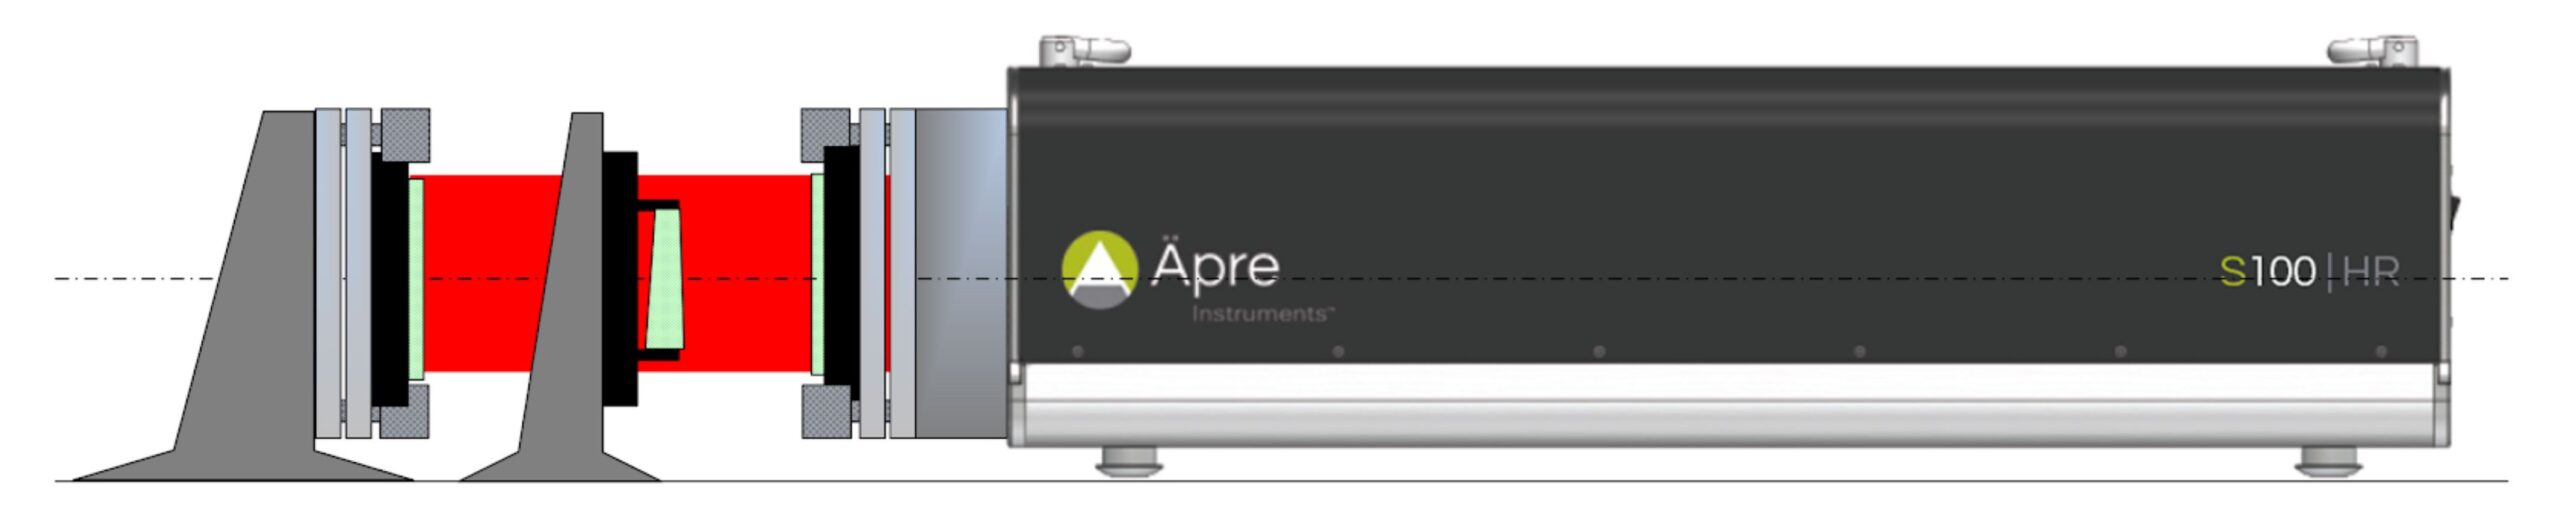
Figure 1: Wedge Setup with basic components, from left to right respectively – mounted Reference Flat (RF), Wedge, and Transmission Flat (TF)
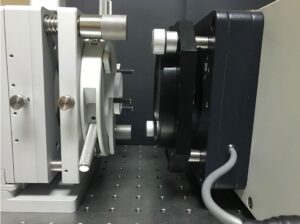
Aligning The TF, Wedge, and RF

The OWA Application
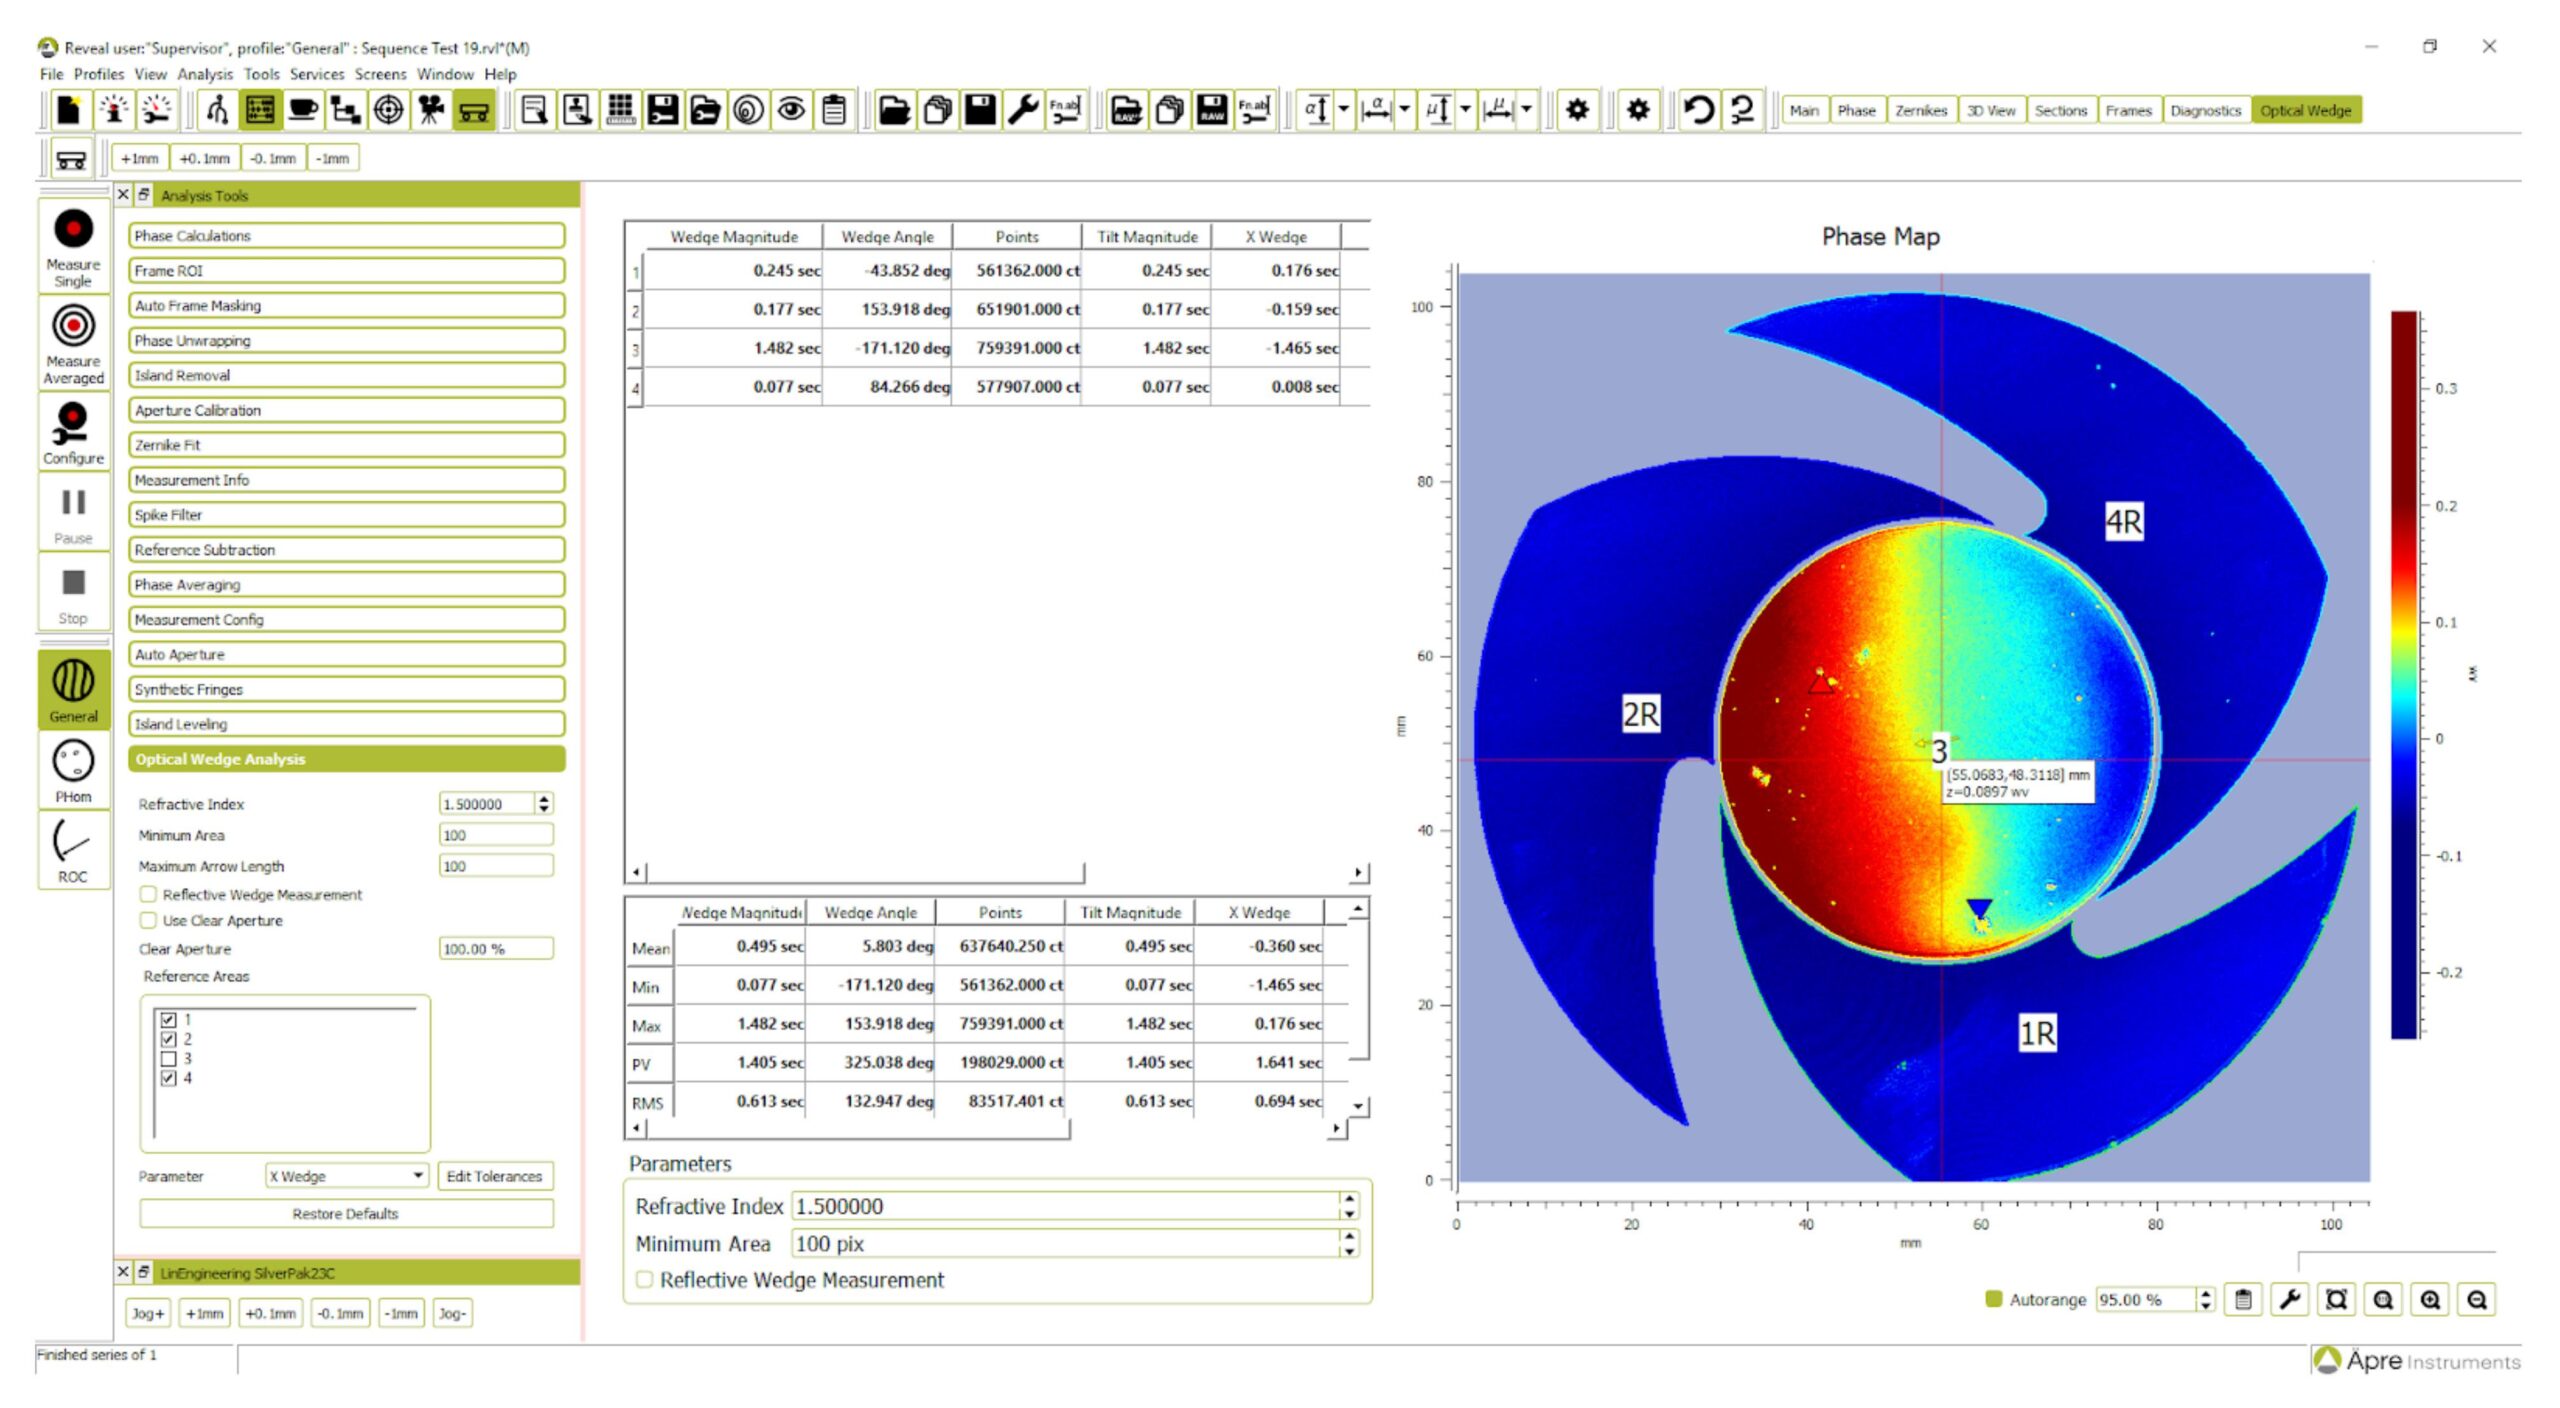
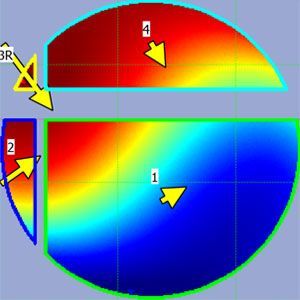
Figure 3: View of optical wedge analysis window in REVEAL for single wedge

Figure 4: View of optical wedge analysis window in REVEAL for two wedges
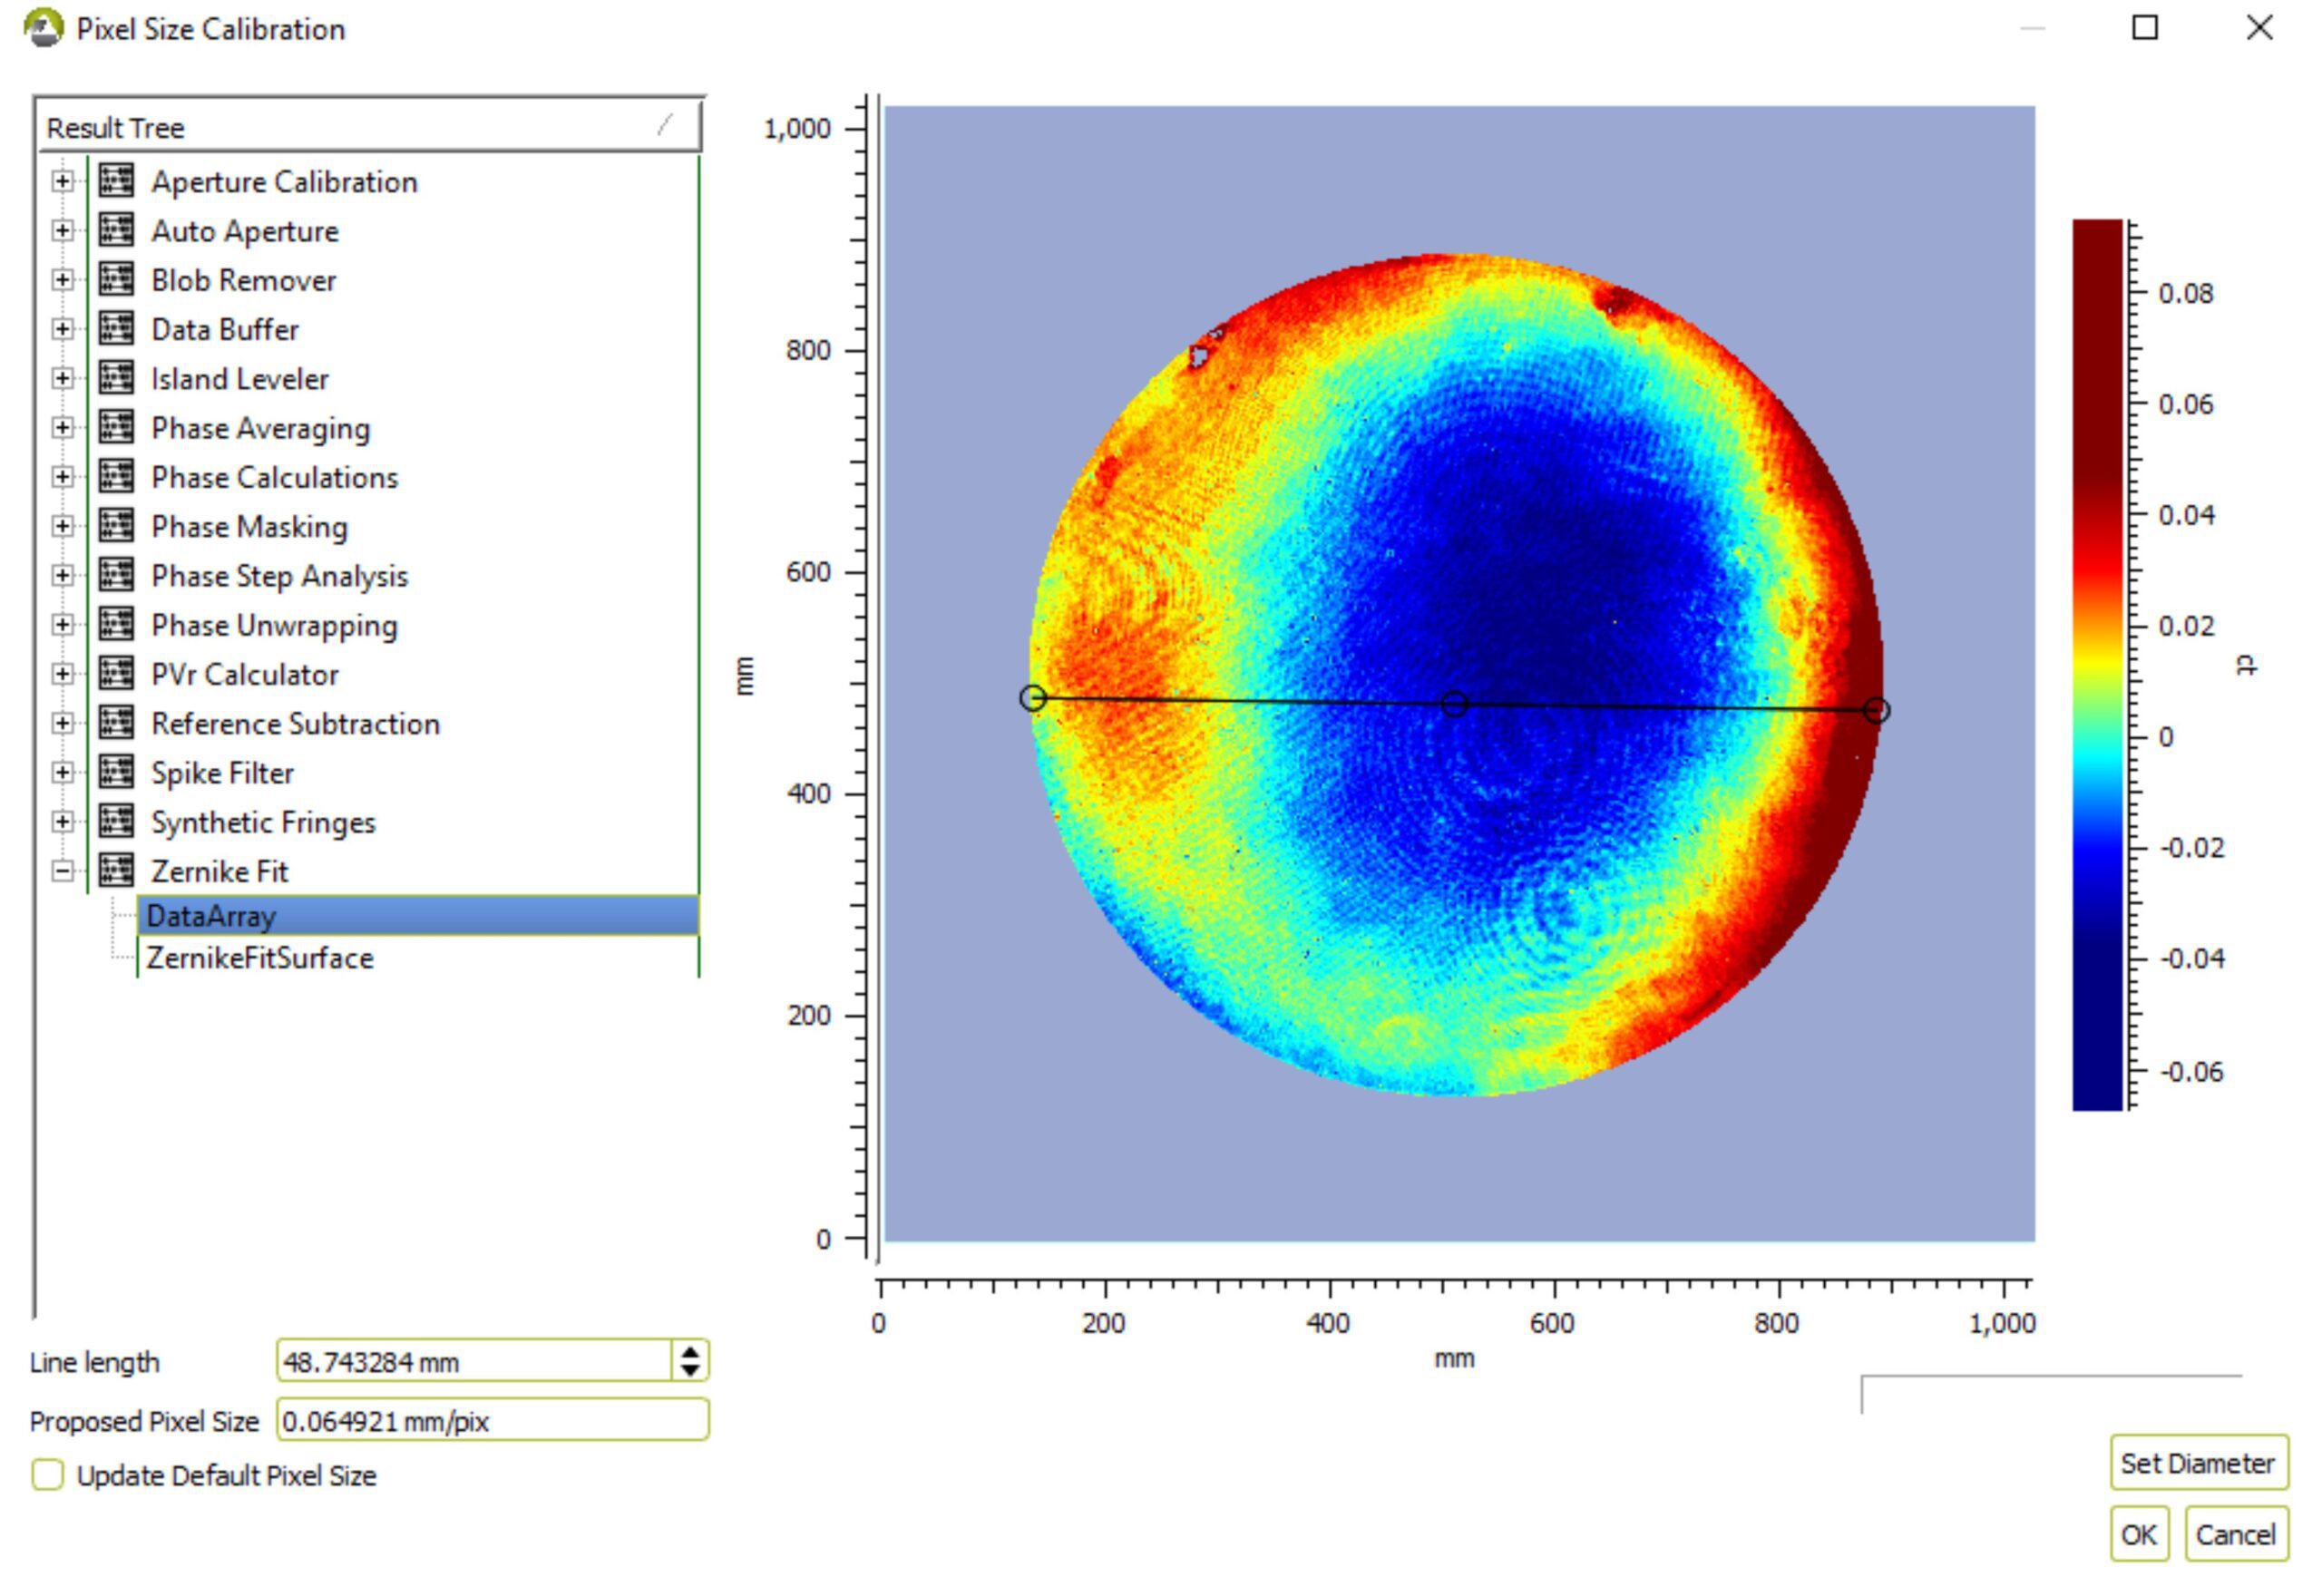
Figure 5: Pixel Calibration tool used to scale the pixel count to units of distance (mm); Test Flat measured has known diameter of 48.74 mm
Identifying the Numerical Wedge Data
Reveal can calculate wedge values for multiple parts simultaneously, that is why wedge analysis results are presented in tabulated form. Each row in the table refers to a single island of data with row index corresponding to the island index shown in the main plot. Figure 6 illustrates how REVEAL tabulates the optical wedge data, with each output based off the numbered islands. Figure 7 shows an exemplary table of statistics associated with the wedge data.
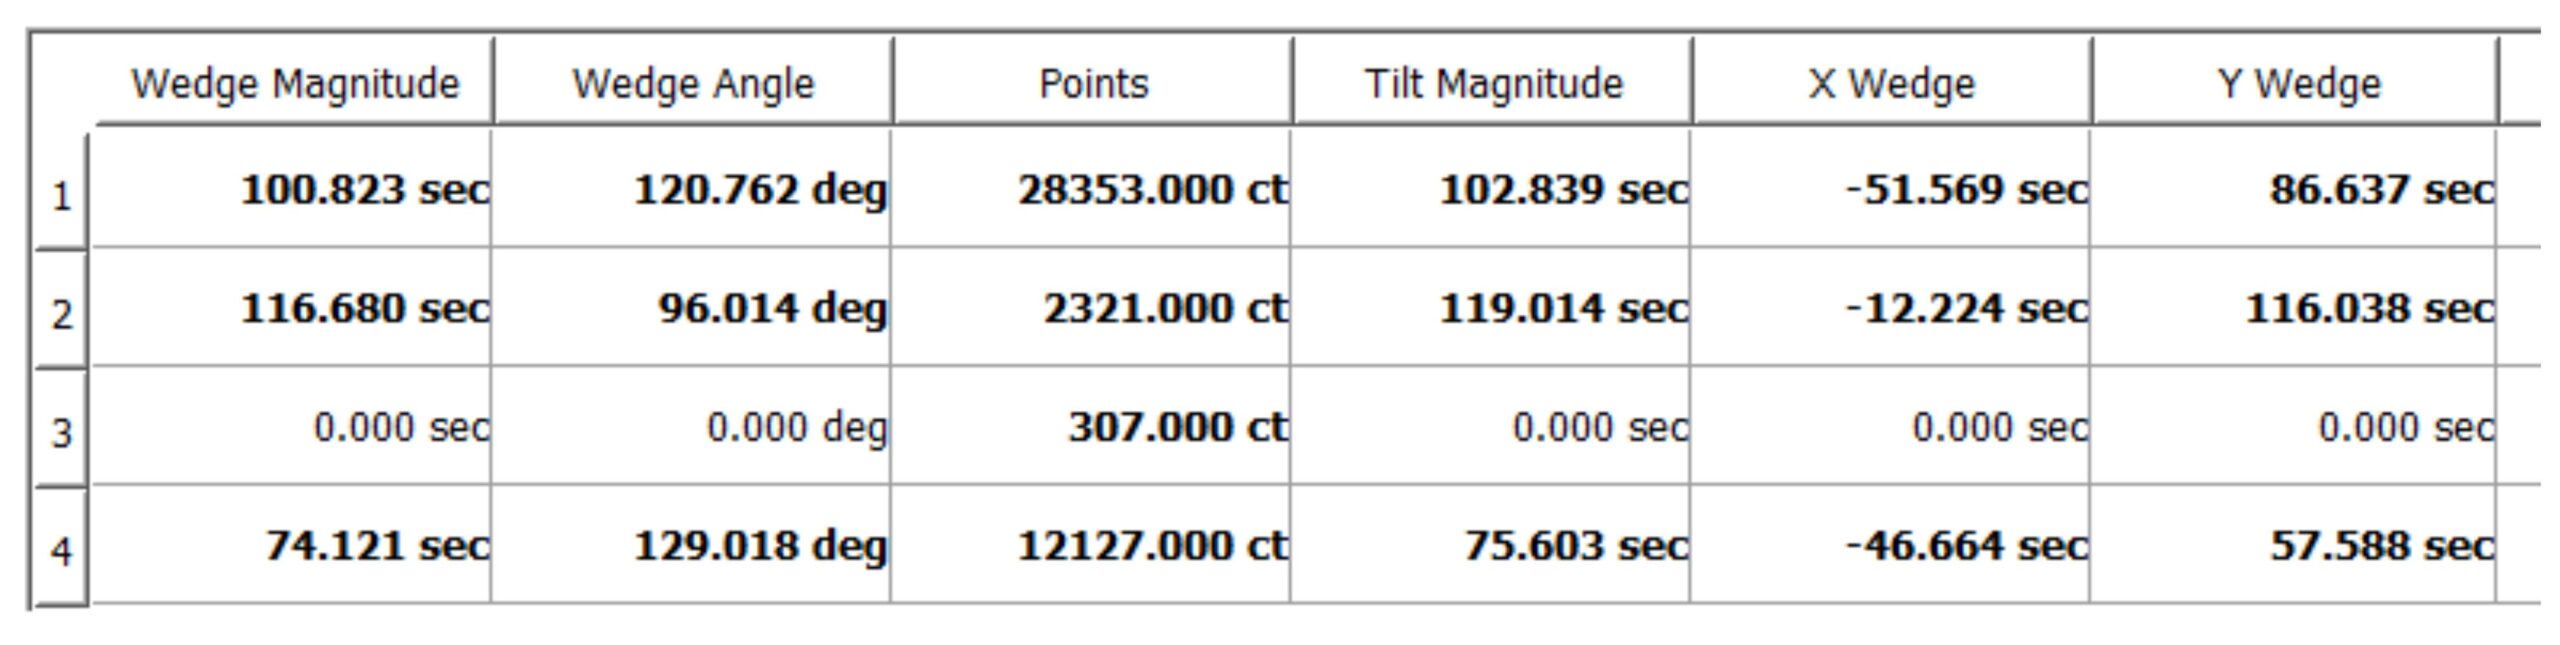
Figure 6: Table of optical wedge data from OWA providing information regarding Wedge Magnitude, Wedge Angle, Points, Tilt Magnitude, X wedge, Y wedge, X tilt, and Y tilt (Phase Map for this data can be found in the Appendix}
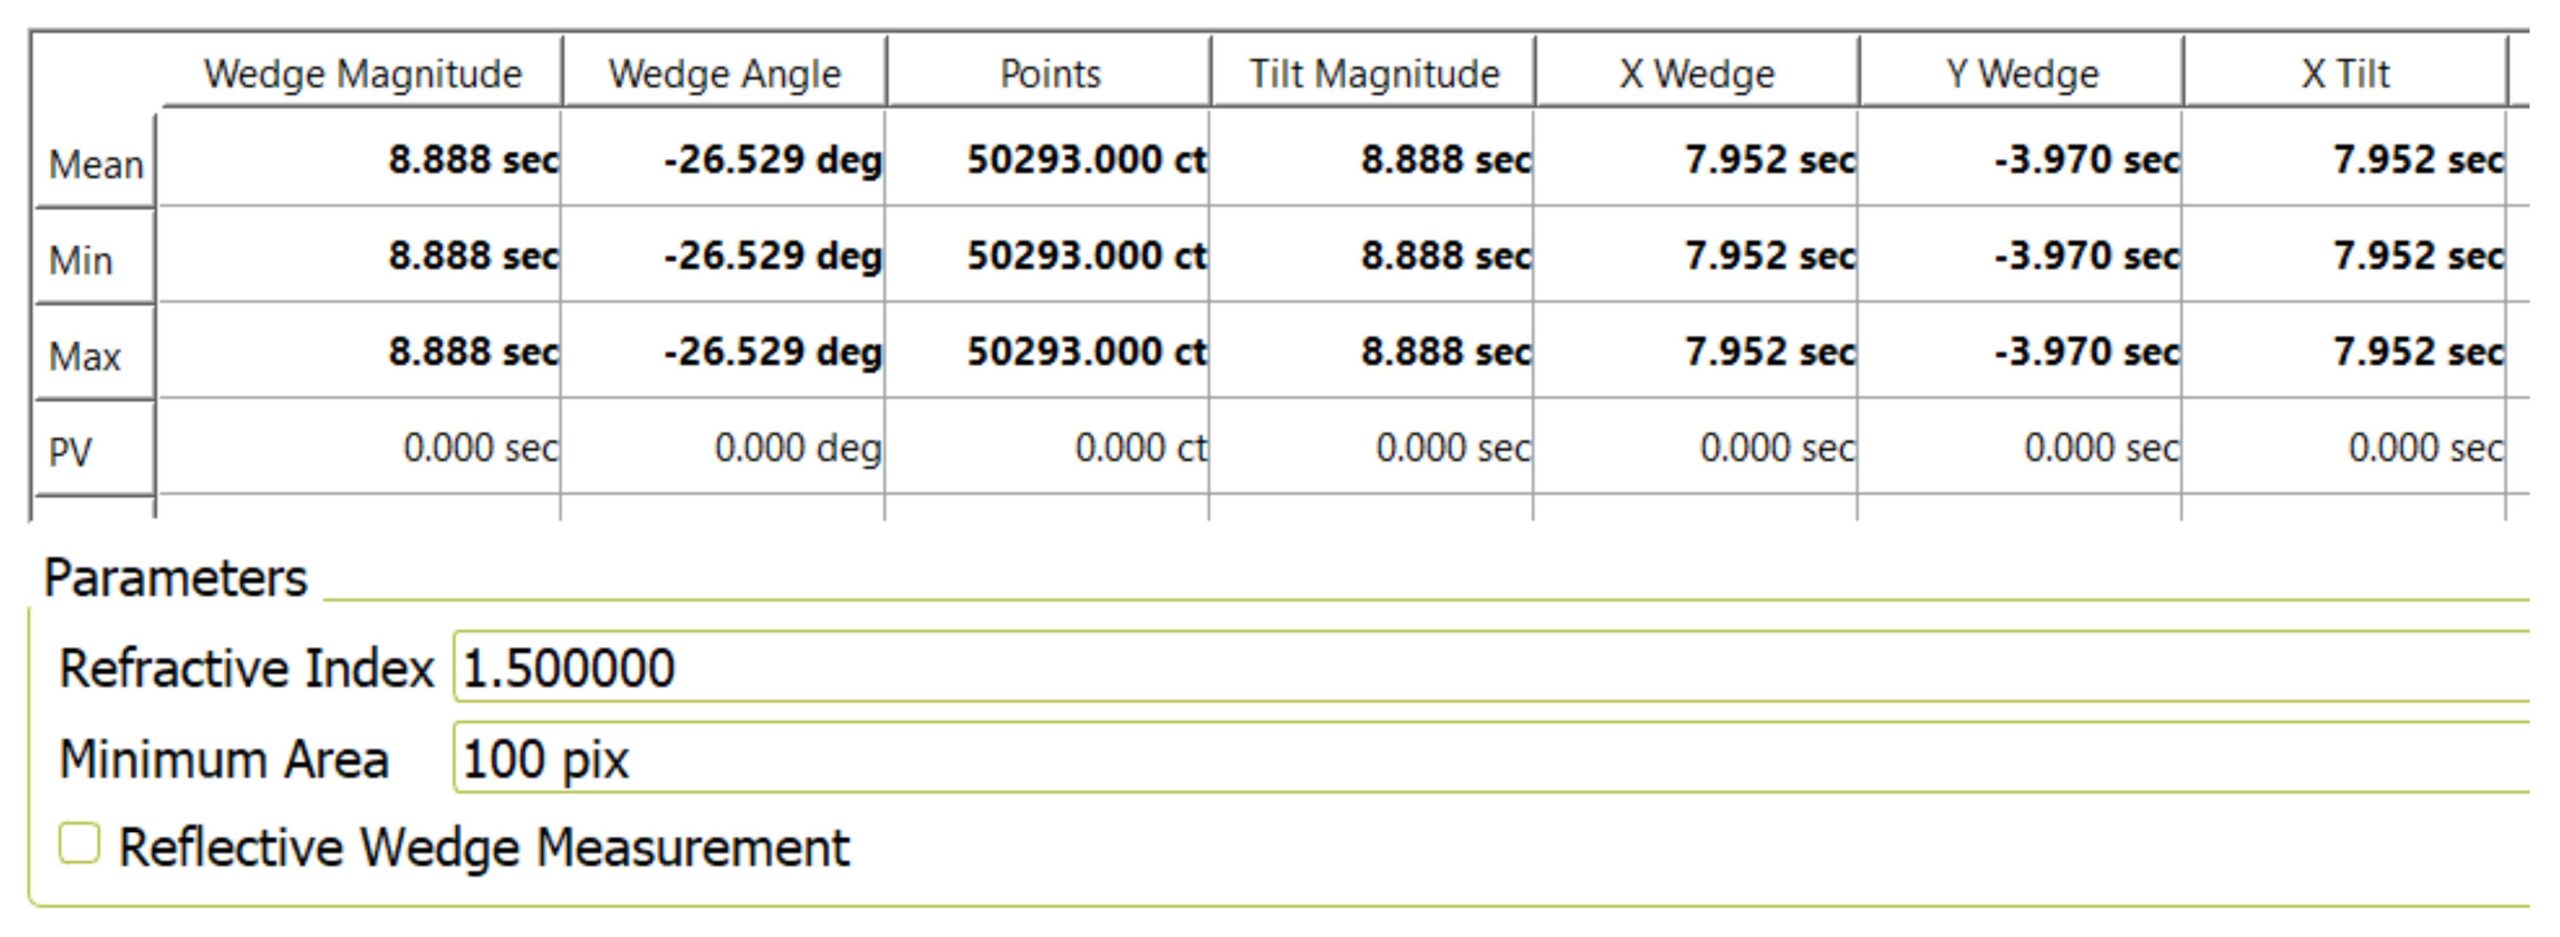
Figure 7: Statistical table of optical wedge data from OWA providing information regarding Wedge Magnitude, Wedge Angle, Points, Tilt Magnitude, X wedge, Y wedge, X tilt, and Y tilt
Printing the Wedge Data
To print a report of the data, go to the Main window, select Report, select Optical Wedge from the “Report Type” dropdown menu, and print.
Optical Wedge Analysis Data
Table 1: Definitions of results produced by wedge analysis
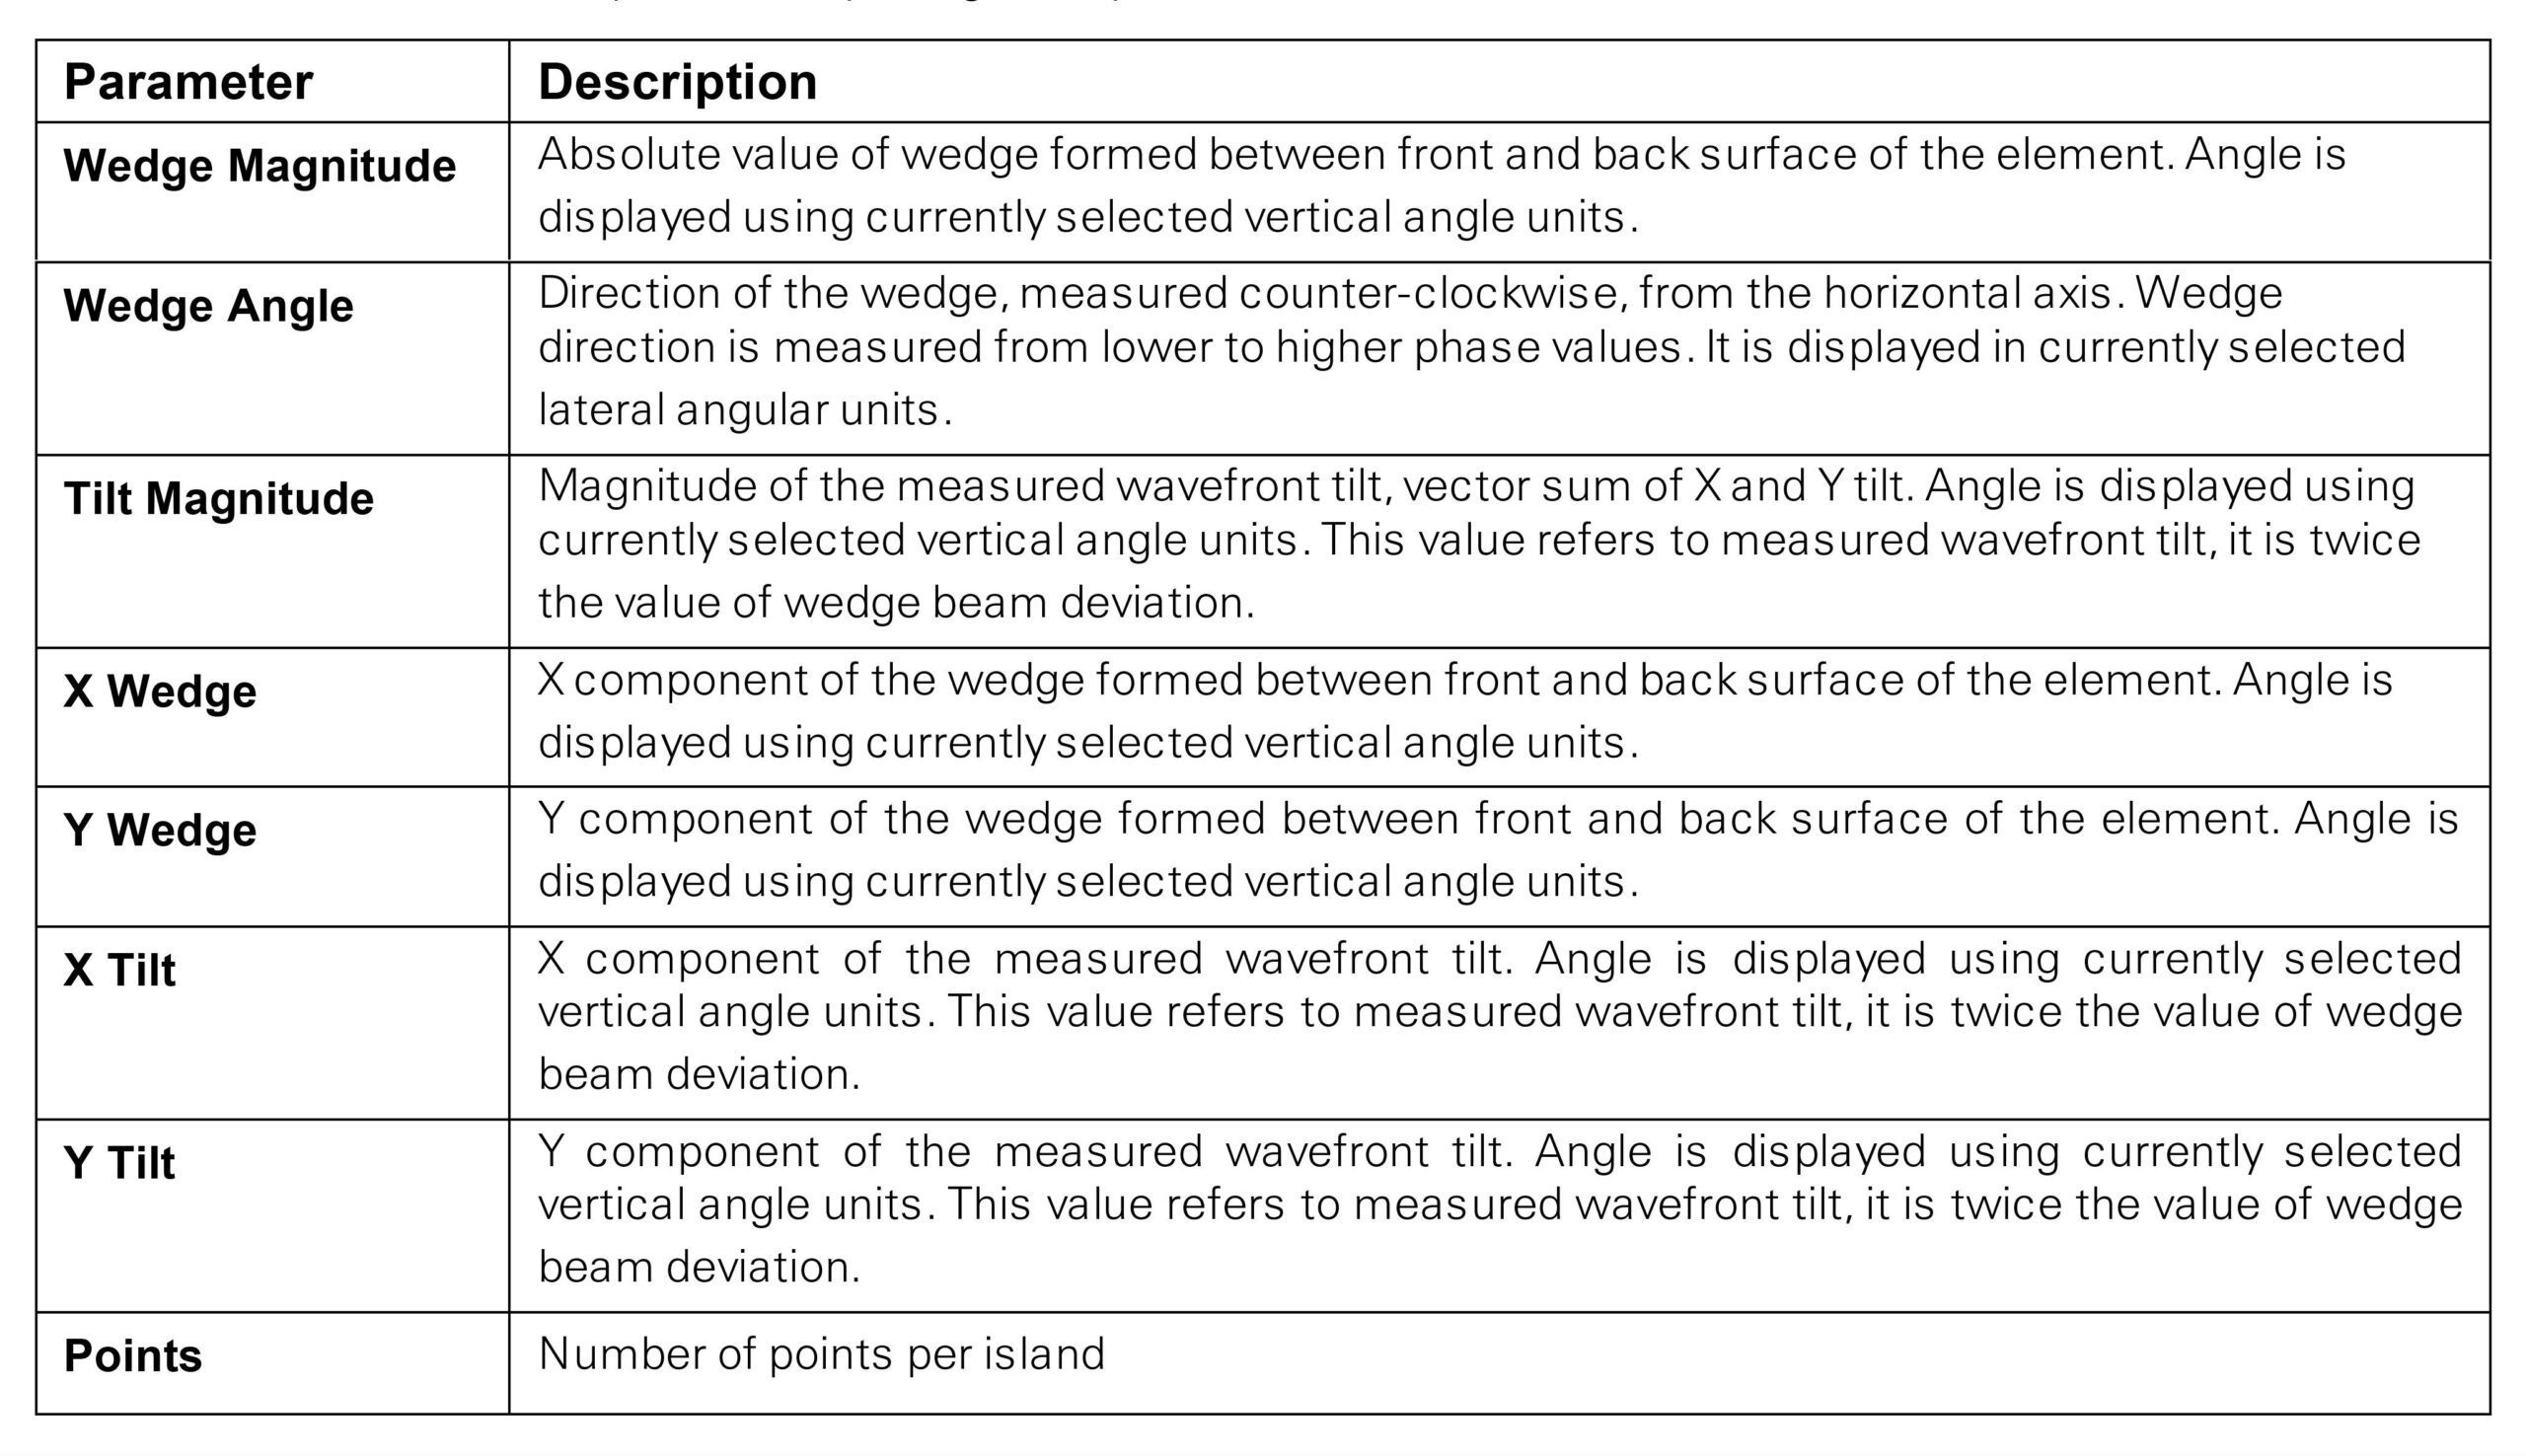
Table 2: Definitions of statistics of the wedge analysis data

Within the Analysis Tools (found on the left-hand side of REVEAL), the Optical Analysis Tool tab has a set of parameters for manipulation according to wedge measurement type and specificity. These tools aid REVEAL in accurately determining the wedge results desired by the user. These parameters, shown in Figure 8, are described below.
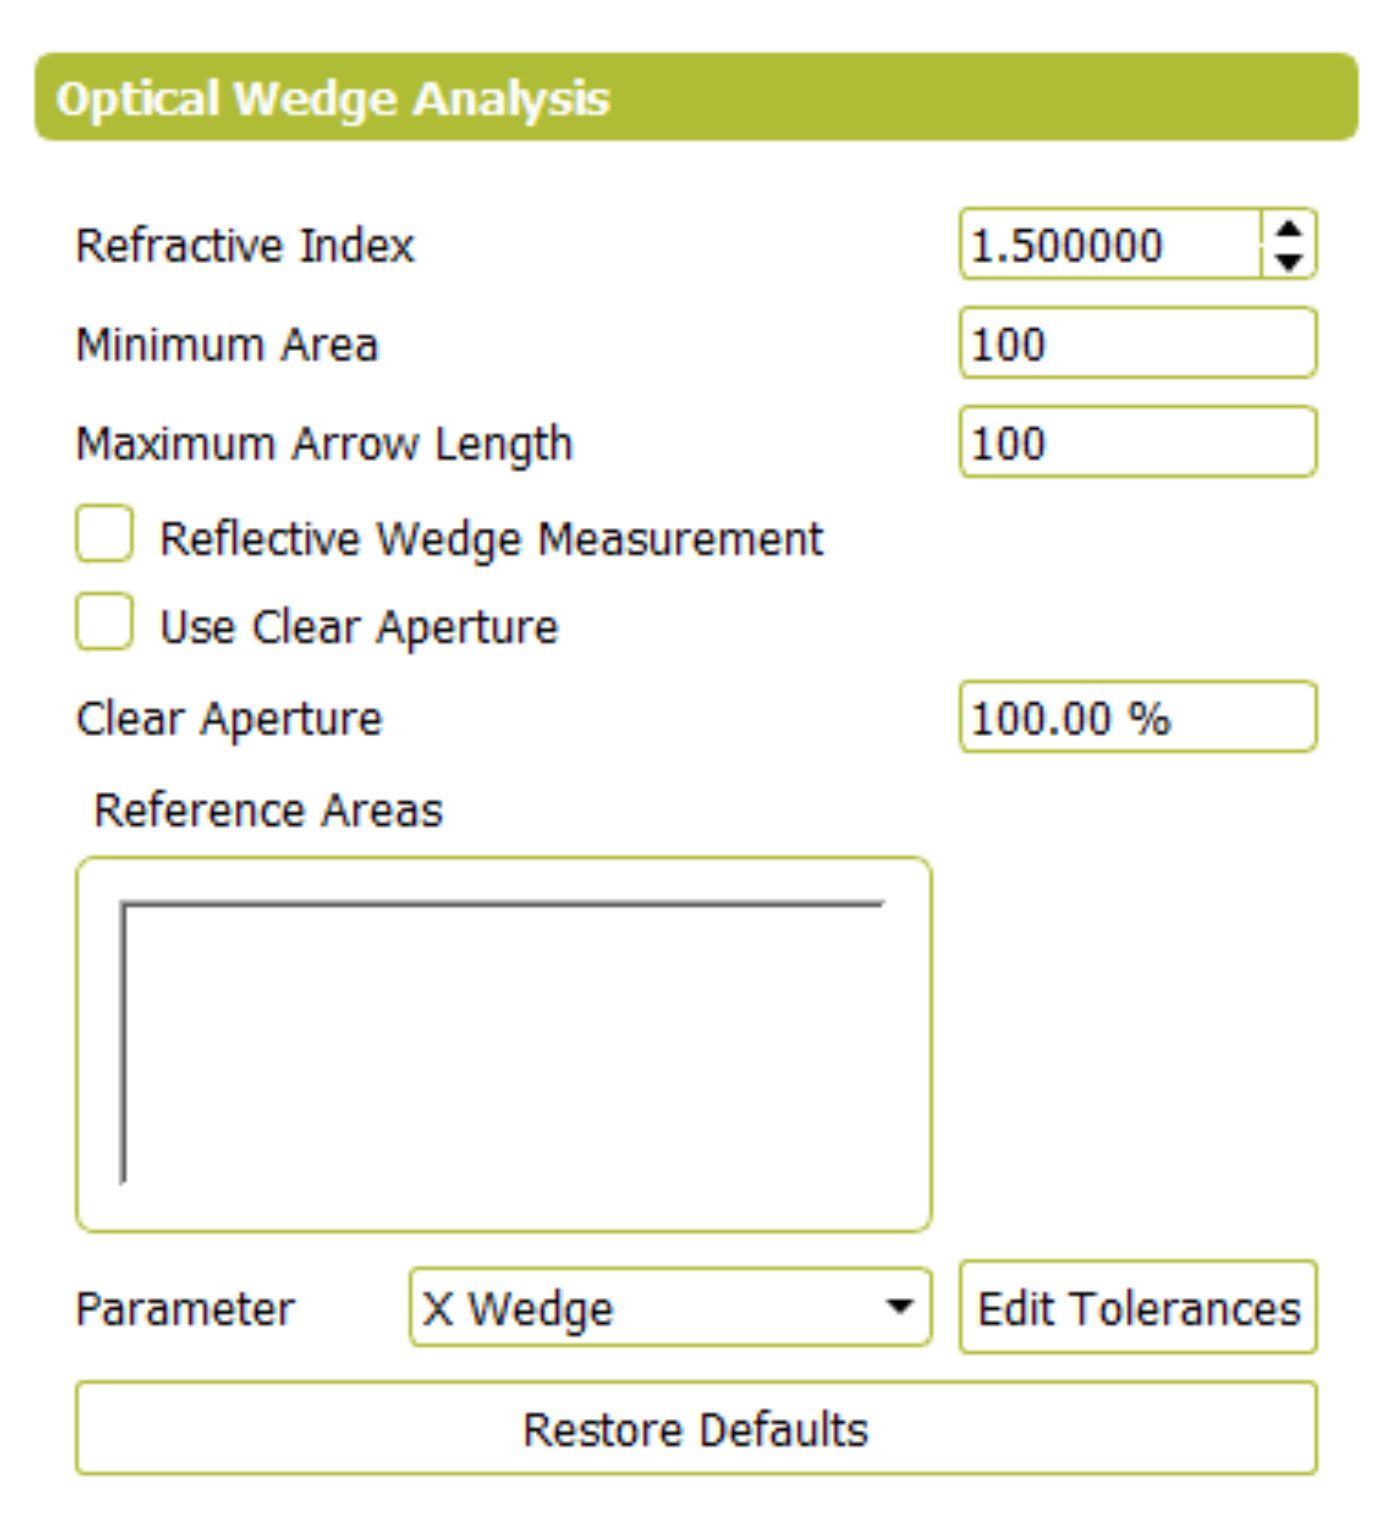
Refractive Index (n): The refractive index of the test optic – in this case, the wedge. The specific n for the wedge must be adjusted accordingly if measurements are taken of a wedge in transmission. When measuring or analyzing a wedge in reflection, check off the box adjacent to “Reflective Wedge Measurement” in the Optical Wedge Analysis Tool tab; this will grey-out the n parameter, as it is not needed in software calculations for wedges in reflection.
Minimum Area: The limit on how small the phase map areas under analysis can be, defined by the pixel count. Reveal reports the amount of pixels measured in each numbered area of the phase map. This pixel count per area is found in the “Points” column of the data table (as seen Figure 6). In order to remove smaller areas of noise from analysis, one can (1) locate numbered regions of the phase map pertaining to noise, (2) find the number of points measured in this region via the data table, and (3) increase the “Minimum Area” value until this region is removed.
Maximum Arrow Length: The limit on how large the phase map arrows in pixels – representing the optical wedge magnitudes within each numbered area – will be displayed. Reveal uses vector to help the user better visualize the orientation of the wedge magnitude in each of the areas enumerated on the phase map. The user has the option to adjust the lengths of these arrows with the “Maximum Arrow Length” parameter.
Reflective Wedge Measurement: This option differentiates between a wedge in transmission and a wedge in reflection. If the test optic is to be tested under reflection, check off this parameter so that Reveal will omit the effect of refractive index in calculating wedge results.
Use Clear Aperture: This option allows the user to focus in on the region of interest or of most importance to the overall functionality of the test optic. Each island of data will be reduced in size to value specified in percent of the original size. Reveal automatically differentiates circular, elliptical and rectangular shapes and applies appropriate algorithm.
Reference Areas: Regions throughout the recorded data that represent the reference area (RF). It is vital to correctly identify parts of the phase map that pertain to the RF. This allows the software to form RF-to-Wedge planes needed for calculating the resulting wedge data.
Parameter: Tool used to select X Wedge, Y Wedge, Wedge Magnitude, Wedge Angle, Points, X Tilt, Y Tilt, or Tilt Magnitude and adjust tolerance parameters. Refer to the REVEAL Manual for more information on the usefulness of the Tolerance tool.
In performing all calculations, the software requires an input value for the refractive index of the wedge under testing as well as identification of which regions of the measured data belong to the wedge and which belong to the reference flat. Identifying the test optic and RF areas allows the software to create a differential plane between the wedge (T) and the reference surface (R).
T-R Difference Plane
It is important to take a good measurement with a uniform phase map across the RF areas so that the differential plane is indeed planar. The correct use of REVEAL‘s analysis tools – like the Auto-Aperture Filter, Island Leveling tool, Spike Filter, and Universal Phase Calculator Correction – establishes this essential uniform phase map. The difference between the uniform RF data and wedge data provide the parameters for the following OWA results:
Wedge Deviation
Refractive Index Greater than 1:
Refractive Index Less than 1:
Phase Map