Spot Polished Spherical and Flat Optical Components – Buyers Guide Chapter 5

In this blog the measurement of spherical and flat optics with a Fizeau interferometer that have been spot polished is discussed.

Spot polishers require improved performance over interferometers with standard 6X continuous zoom imaging

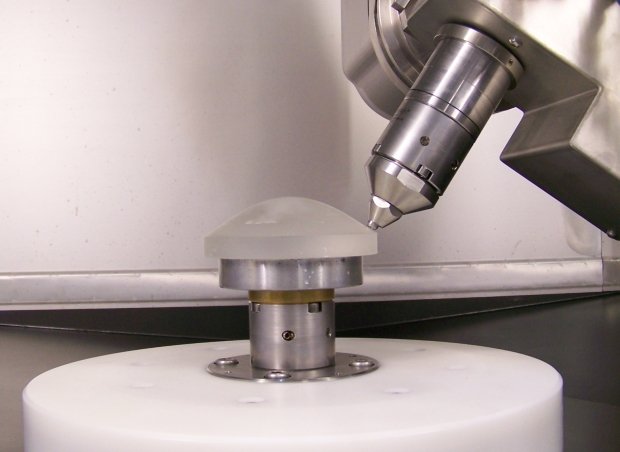
Spot polishing machines for rapid manufacture of standard and high accuracy spheres place new requirements on interferometer systems. The spot polishing method can create small ripple in the surface while shaping the overall form. Accurate positioning of the polishing spot is required to correct the surface errors to bring the surface into specification. To guide the spot polishers image distortion, resolution, and pixel scaling (calibration) are important  These requirements primarily drive the imaging system of the interferometer. Continuous zoom system do not meet these requirements.

Modern Imaging Systems

Modern interferometers have discrete or fixed magnification imaging to improve resolution, and minimize distortion and ray tracing errors. All the interferometer optics are exposed to coherent laser light which highlights surface defects.  Therefore the optics must be high quality to supress bulls eye artifacts (stray fringes) from scratches, pits, dust and reflections. These hight quality optics increase the system cost.

Interferometer Image Resolution

Increased resolution is required to measure mid-spatial frequency surface features. These features can be defined as the residuals present after the removal of 36 Zernike polynomial terms (see REVEAL analysis screen below, the image on the right are the residual mid-spatial frequencies). Mid-spatial frequencies in an optical surface scatters light degrading the image or lowers directed energy concentration. Therefore they must be measured and corrected.

Mid-spatial frequencies are measured with a high resolution imaging system. Typically greater than a megapixel camera is required. The resolution is limited by either the optical design or the camera resolution. If the camera limits then the smallest feature measurable is approximated by 80% of Nyquist frequency
(1-line/mm:2 Pixels), or ~400 lines/aperture for a megapixel camera. At 50 mm field of view, approximately 125 µm feature can be imaged. Continuous zoom interferometers are limited to <100 lines/aperture.

Interferometer Image Distortion

Image distortion maps a surface feature in the wrong position, and the polisher will move to the wrong position. In the best systems the camera limits resolution. As noted 400 lines/aperture is the practical limit of resolution in a megapixel camera, so distortion of 1/400 or 0.25% is required. The polishers polishing function might decrease this requirement, but with 0.25% the interferometer will not be the limiter. For higher resolution cameras the 80% Nyquist again drives distortion… more pixels better distortion requirements, yet practically the polishing function (the shape of the polishing spot) is the limiter. Continuous zoom systems can exhibit up to 2% distortion – 10X higher than modern interferometers.

Interferometer Ray Tracing Errors

When the test part deviates from a sphere many fringes are seen. These fringes indicate high slopes between the reference and test wavefronts. When high slopes occur the test and reference wavefronts traverse different paths through the imaging optics. These divergent paths create wavefront errors in an uncorrected interferometer system. This error can be measured by acquiring data with a null interference cavity, saving the data and then acquiring data with the maximum number of tilt fringes that can be measured and subtracting the two results.  The residual error will primarily be due to ray tracing errors and is seen as coma and astigmatism, and sometime spherical aberration. In the old continuous zoom systems thes

e errors can be as large as a wave of error.  Even for the small amount of slopes they can measure.  

To speed the convergence of the polishing correction process minimizing these ray tracing errors are required. Only the highest quality systems are corrected for ray-trace errors.  

Summary

For spot polishing of spherical and flat components a low distortion, high resolution interferometer with low ray trace errors is desired.  

Next Post: Next we discuss special applications, starting with Harsh environments
Optical System Alignment and Wavefront Measurement – Buyers Guide Chapter 4

In this blog the alignment of optical systems with a Fizeau interferometer is discussed.

The goal of a system wavefront test is alignment and confirmation of system performance. The measurement of optical system wavefront often requires a custom interferometer. When a fully reflective system is measured a standard HeNe laser Fizeau is sufficient as the wavelength does not matter.  For refractive systems the wavelength often must match the optical system design, and optical system wavelengths vary from 10.6 um to 193 nm.  Thus these systems are often “custom” except for a few wavelengths that are more common. For this discussion the wavelength is assumed to be matched to the system.

Zernike polynomials are often used to define system wavefront errors during alignment

Null Test

If a null, adjust until near-zero error is the goal then a standard continuous zoom system can be sufficient.  At null ray trace errors are minimized and wavefront imaging distortion error minimal.  Further mid-spatial frequency errors are not critical when measuring system alignment. Some of these measurements are made with a null corrector lens that matches the system under test wavefront with the interferometer expected wavefront, either spherical or plano.

Non-Null Testing

Subsystem testing can produce non-null wavefronts in the final alignment.  For non-null system an interferometer with low ray-trace errors is important. With high fringe density, or high slopes, ray trace errors grow. Ray-trace errors are developed when the test and reference wavefront traverse diverging paths to the camera and are seen primarily as coma and astigmatism, with sometimes spherical errors.  If the final “aligned” condition is at 10 waves of spherical aberration then unless the interferometer is well corrected for ray-tracing errors the data will exhibit errors in final alignment.

Precision alignment is important for optimal optical system performance, especially with more complex optical paths.

Small systems

A bench top system test is similar to measuring an optical component and standard phase shifting data acquisition is sufficient.

Real Time Adjustment

Recently the introduction of widely available simultaneous data acquisition interferometers have enabled near real time phase.  So alignments can be adjusted continuously for more rapid convergence on alignment.  

Large Systems

For large systems, typically telescopes, vibration and turbulence become an issue. If an issue then only a simultaneous phase measuring system will be able to acquire data.

Summary

In most cases a standard interferometer with near matching wavelength is sufficient to test optical system wavefront. Where large or non-nulled cavities are involved a high performance interferometer with low ray-trace errors and/or simultaneous phase measurement need to be used.

Next Post: Small tool polishing applications

Lap Polished Flats, Spheres and Prismatic Components – Buyers Guide Chapter 3

In this blog the measurement of optics with a Fizeau interferometer that have been lap polished is discussed.

What interferometer is needed to produce good parts? Each manufacturing process requires a specific measurand, the quantity to be measured, to provide the feedback necessary to control the process and produce good parts.  In the following posts several applications will be discussed with optional systems highlighted. 

Random, Near of Full Sized Tool Polishing

Classic Spindle Polisher/Grinder

The historic method to manufacture optics has been random polishing on a spindle polisher.  The procedure of rough forming the surface

shape, grinding to near polish and then lap polishing has been used for hundred of years.  The beauty of lap polishing is the random nature, averaging over large areas of the sphere, which self corrects, and lead to high quality surfaces.  Further the mid-spatial frequency ripples, the residual surface features remaining after the removal of 36-Zernike polynomials, tends to be suppressed due to averaging. There are limits and caveats as always, yet in general these are reasonable assumptions. Thus the measurand is simply the shape of the surface as defined by 36 Zernike polynomial coefficients. 

The Old Zygo® Mark II Optics Sufficient

Since the meaurand is simply low spatial frequency shape, in this application, a continuous zoom imaging interferometer, with the inclusion of phase measurement is sufficient. This is why the Mark II architecture as been useful for over 35 years, it was sufficient for nearly all optics produced until this century. The low spatial resolution of the imaging system (no matter the camera resolution), and inherent image distortion of the zoom lens up to ~2%, and slope induced errors have little effect on measurement uncertainty of flats and spheres when measured at a null fringe condition.

Vibration Tolerant Data Acquisition Important

More important than the optical system for this application is the data acquisition and analysis software. This starts with vibration tolerant phase data acquisition as found in modern systems to report phase data without the influence of the production environment vibration. (We plan to discuss the history and development of vibration tolerant PSI in a future blog.) Further the software must be compatible with standard industry standards including ISO and data formats (.dat formats), and be easy to use.

Upgrading an Old Interferometer Is a Good Option

To stay current and meet the the requirements of lap polished optics there are two choices: Buying new or upgrading. The first option is purchasing a newly constructed system with classic optical components that has a new data acquisition system. The second is simply upgrading a classic system to a modern data acquisition system (with vibration tolerant algorithms). The performance of each will be equivalent, with the upgrade being much less expensive.

Summary

Lap polished Flats, Spheres and Prisms in a normal production environment are sufficiently measured with a continuous zoom system, where the value choice is often a system upgrade.  

In the next post we’ll explore what is an appropriate interferometer for transmitted wavefront measurement.

Measurement Repeatability: How much is enough?

How many times have you looked at an interferometer specification and to see a number under Simple Repeatability like λ/10,000 and wondered, “Who cares?”  Add to this the long footnotes that tell you how the number was obtained, usually through significant averaging, idealized short interferometer cavities (think 1 mm) and statistics from around 30 measurements.  Then the RMS is reported which further averages the data.  When you consider how an interferometer is used, a 1 mm cavity coupled with averaged data seems irrelevant.

The escalation of specifications like Simple Repeatability has occurred for a couple reasons:  First, some purchasing departments buy purely on specification, and if one system’s Repeatability is lower than another system’s…guess who wins.  And second, there is potentially a bit of pride in saying our numbers are the best.  Notice the reason is not to tell the user what is important, or what is “good enough”.

Repeatability considerations:

  • Repeatability only applies to each particular measurement situation.  Environment, part interactions with the interferometer ( for example stray light), and the interferometer data acquisition play a role.
  • Another variable not seen on specification sheets is REPRODUCIBILITY.  It does not appear because it can only be measured for a particular measurement in the use environment.  Reproducibility is the variation due to operator to instrument interactions (tilt fringes for example), long term environmental variations, fixturing induced errors and other unforeseen complications.
  • In many industries a GR&R test is used to quantify and separate the contributions of repeatability and reproducibility. The typical target for a GR&R test is ≤10% (combining both contributions) of the measurement tolerance.  For a λ/10 P-V surface that means a λ/100 P-V, or ~λ/500 RMS GR&R.  A far cry from λ/10,000 reported.
  • This does not mean that ~λ/500 RMS GR&R is easy to achieve.  When considering real life conditions ~λ/500 RMS GR&R can be very hard to achieve.  The important issue is knowing what your GR&R is compared to the desired tolerances to see if the measurement is meaningful.

From a metrology viewpoint repeatability as reported on specification sheets is meaningless.  GR&R is the meaningful parameter to use for your measurement set up and tells the true story.

What other specification really matter and why?

Let us know what you would like discussed.

Thank you for reading.


Which Result is “Right”?

What accuracy can be achieved with an Interferometer?

Instrument correlation sets a performance base line for metrology instruments.  When parts are manufactured and shipped, correlation between vendor and customer is expected.  If metrology systems do not correlate arguments ensue regarding who is right.

Several years ago I received a call from a quality manager.  He was unhappy with the results of a correlation study comparing several interferometers in his factory.    The test was simple.  He manufactured several parts and measured them on the various systems.  Each system was stand-alone and had its own set of λ/10 accuracy transmission sphere reference optics.  The temperature throughout the factory was held to ± 0.2C and only trained operators were used.  Surprising to the QC engineer, the measurements only agreed to λ/5.  2X worse than expected.

Why?

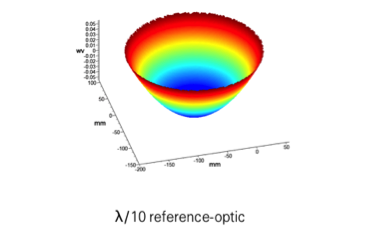
There is a common misunderstanding that since λ/10 reference-optics are accurate to λ/10 that  instruments using them will correlate to λ/10.  Yes the reference-optics are accurate the λ/10, that is ± λ/10.  Therefore when you compare results they can correlate too much better than λ/10 (down to the instrument noise if low pass filtering is applied) or differ by λ/5, just what the quality manager noticed.

How does this affect vendor quality control and customer inspection?

When measuring spherical and flat optics the measurement uncertainty to first order is determined by the reference optics accuracy.  For aspherical optics this is not the case, and might be the subject of a future blog.  So lets keep it simple and assume spherical and flat optics are being manufactured.  In practice the application of error sources is somewhat more complicated for spherical optics, the following argument is true for flat optics and mostly true for spherical optics. For flats the lowest order error is power, for spheres the errors of interest are 3rd order Spherical, Coma and Astigmatism.

The VendorShipping Tolerance

The manufactured part has a tolerance; we’ll assume is λ/2 for this example.  When the part is measured the result includes the part shape error and the reference optic uncertainty, an unknown but within ± λ/10. Therefore if the measurement is on the high side it can be as poor as + λ/10 worse, and if on the low side – λ/10 worse than measured.

To be assured the part meets specification it must be manufactured to ± λ/10 tighter tolerance, shown in figure 1.   Now the manufacturer knows the part is within tolerance, and is certain they are shipping a good part.

The CustomerReceiving Tolerance

Upon receiving the part the opposite is true.  The customer has no knowledge of the sign of the reference surface optics error.   Therefore the parts must be accepted if the measured surface error is within the tolerance PLUS the reference surface uncertainty as shown in figure 2.  The customer must be certain they would only reject out-of-specification parts, and this means opening up the tolerance based on the reference surface accuracy.

Design Tolerances Must Consider Metrology To Assure Optical System Performance

The summing of these uncertainties and the epistemological problem drives optical specifications to tighter tolerance.  At some point, about 2X the reference surface accuracy, meeting specification becomes expensive due to the tightened tolerance window.  At this point improving the reference surface accuracy will open up the manufacturing tolerance window decreasing manufacturing costs.   Three methods are available to improve reference surface accuracy:

  • The easy method costs money, purchase ± λ/20 reference optics – or better.   This can be cost prohibitive.
  • Using a three-flat test or a two-sphere test to achieve “absolute” calibration.  This works well in theory.  Practically the test must be performed with careful attention to alignments to improve the reference surface.
  • The most recent test is a calibration ball where averaging is used to calibrate a spherical reference surface and has shown promise in well defined conditions.

Good Metrology Practice

Understanding the role of reference surface accuracy in optical metrology leads to improved tolerancing, establishing appropriate test procedures within manufacturing processes, and an approach to minimize disagreements between vendors and customers.